Nicki Camberg
Data Journalist at Hearst Television
As seen at Axios, CNN, Chartmetric, The COVID Tracking Project at The Atlantic, etc.
Email me at Nicki.Camberg@Hearst.com
SubscribeData Journalist at Hearst Television
As seen at Axios, CNN, Chartmetric, The COVID Tracking Project at The Atlantic, etc.
Email me at Nicki.Camberg@Hearst.com
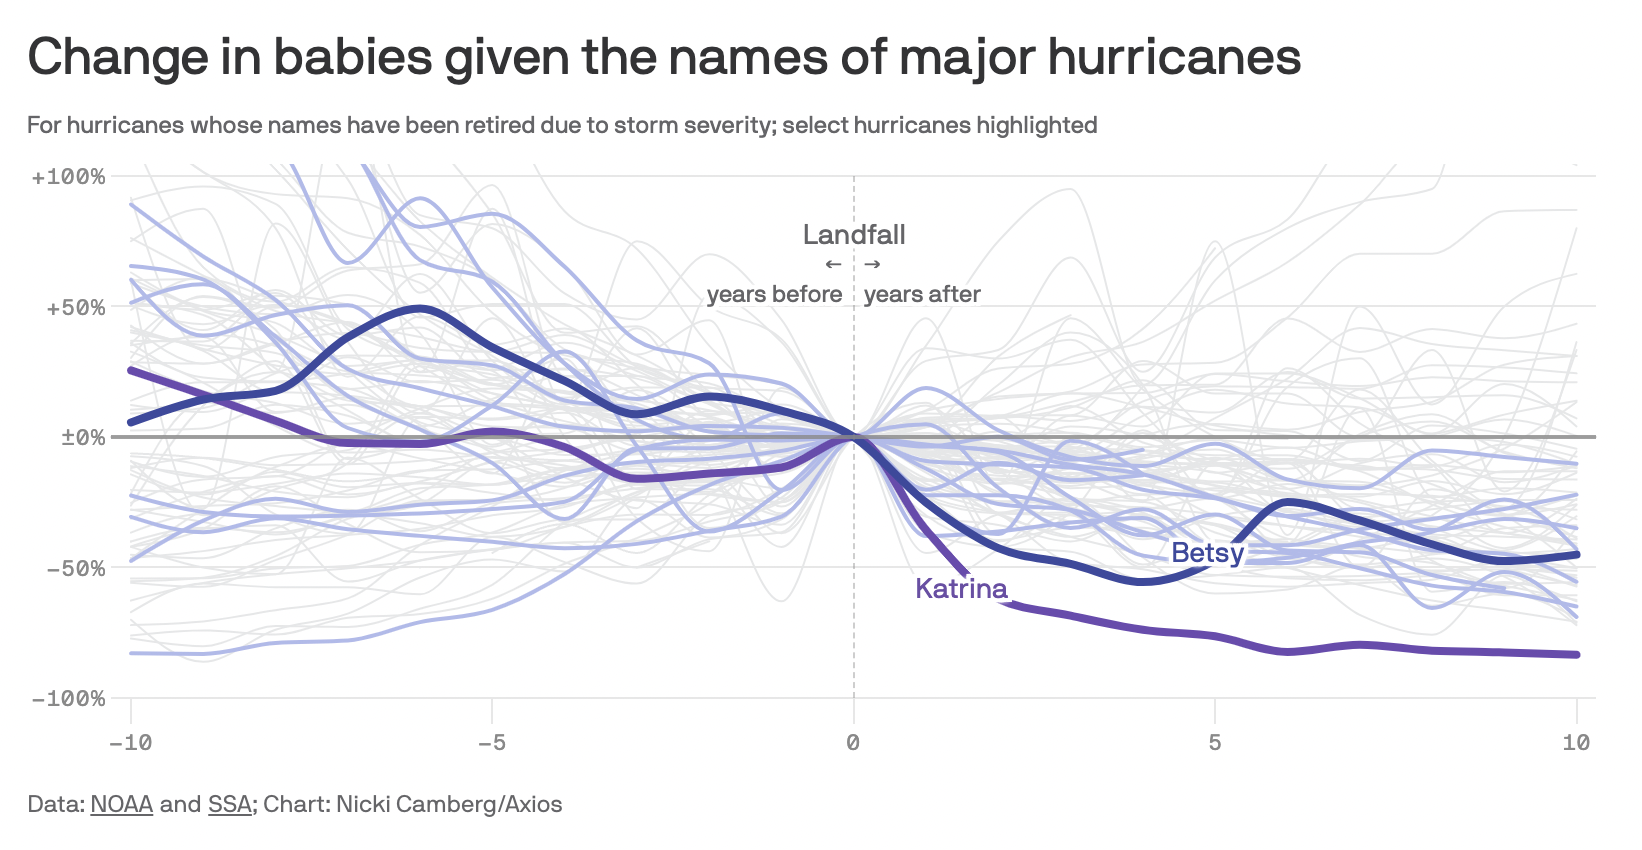
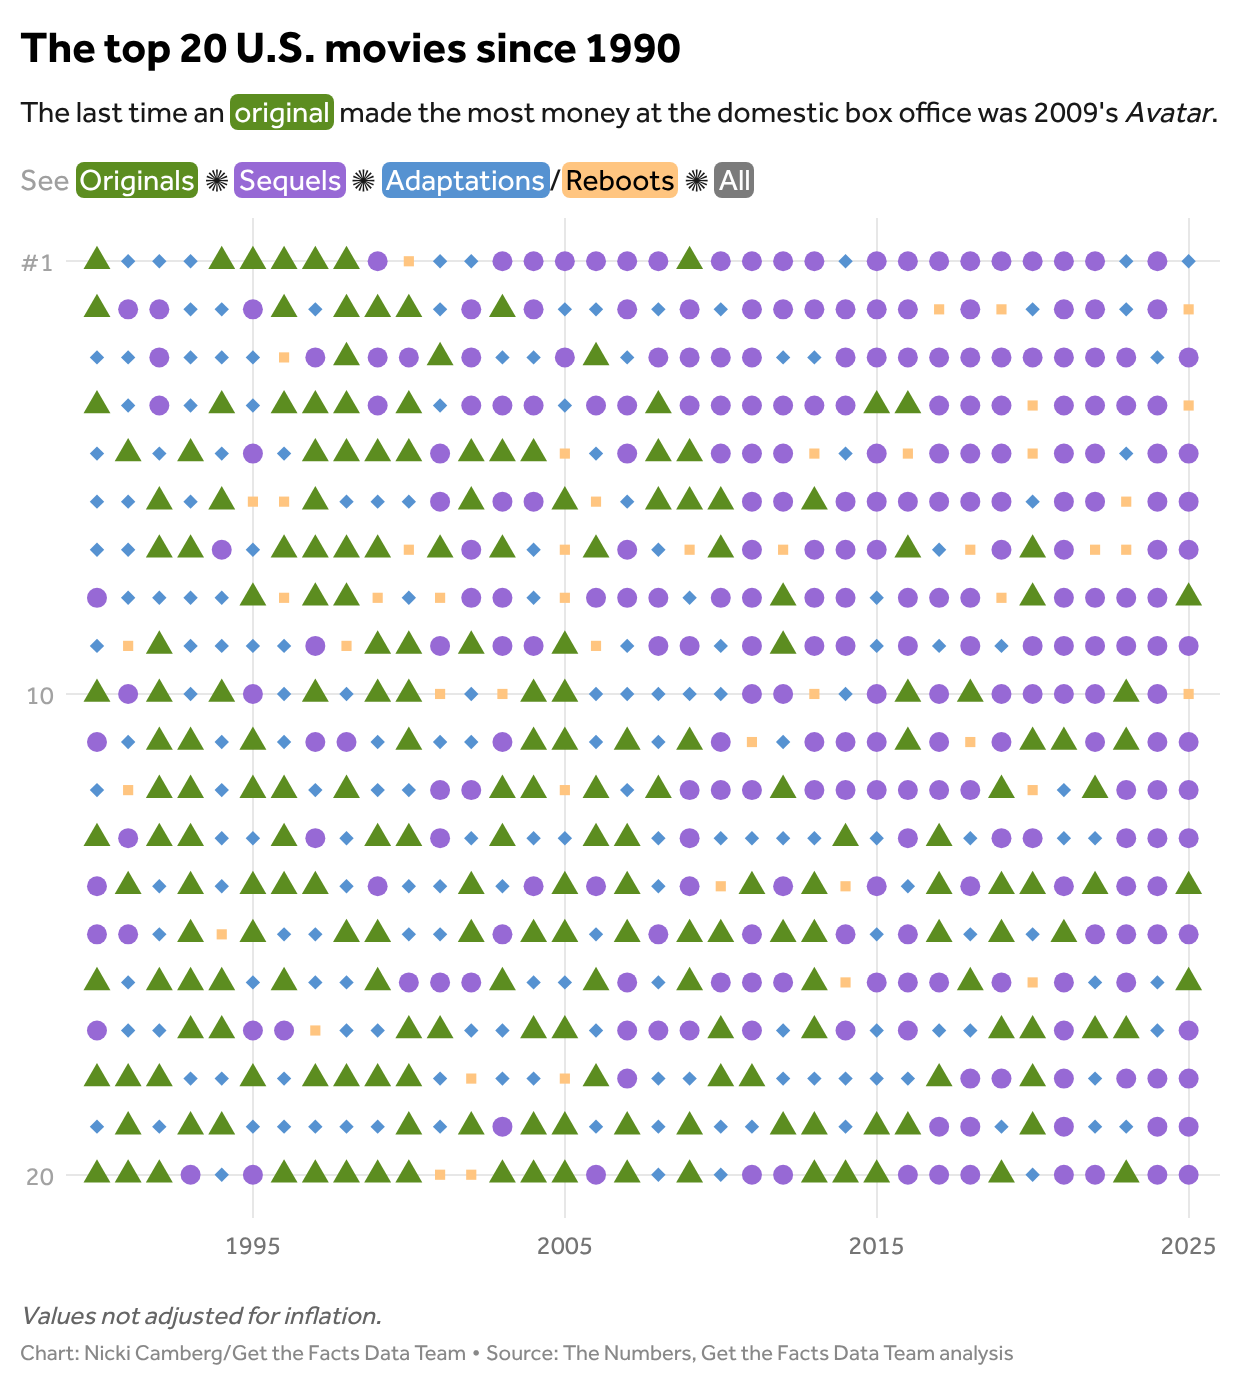
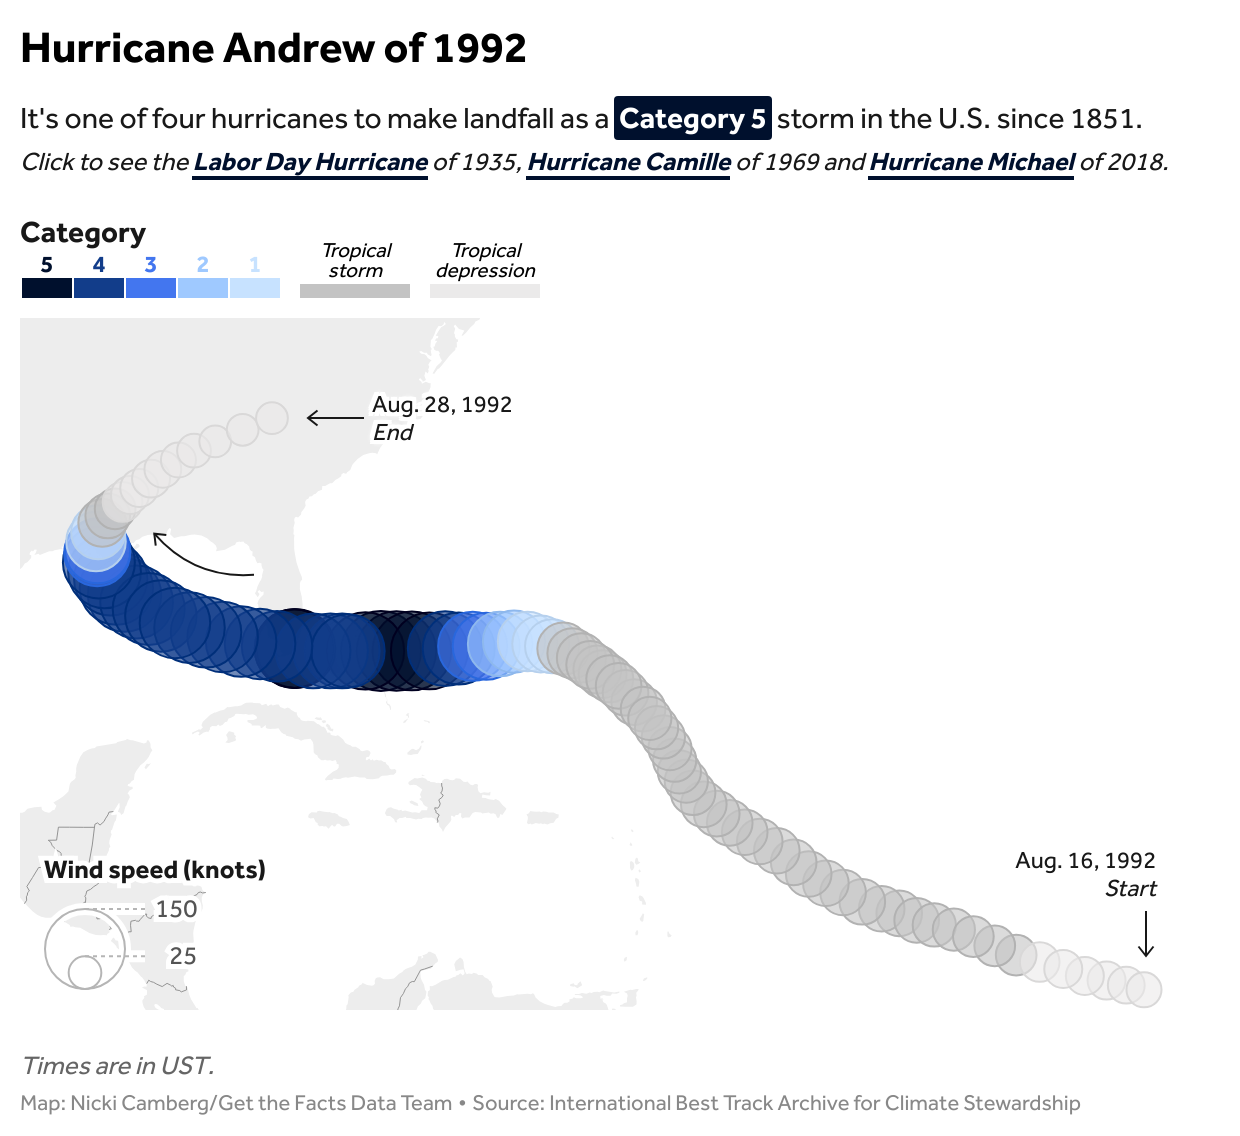
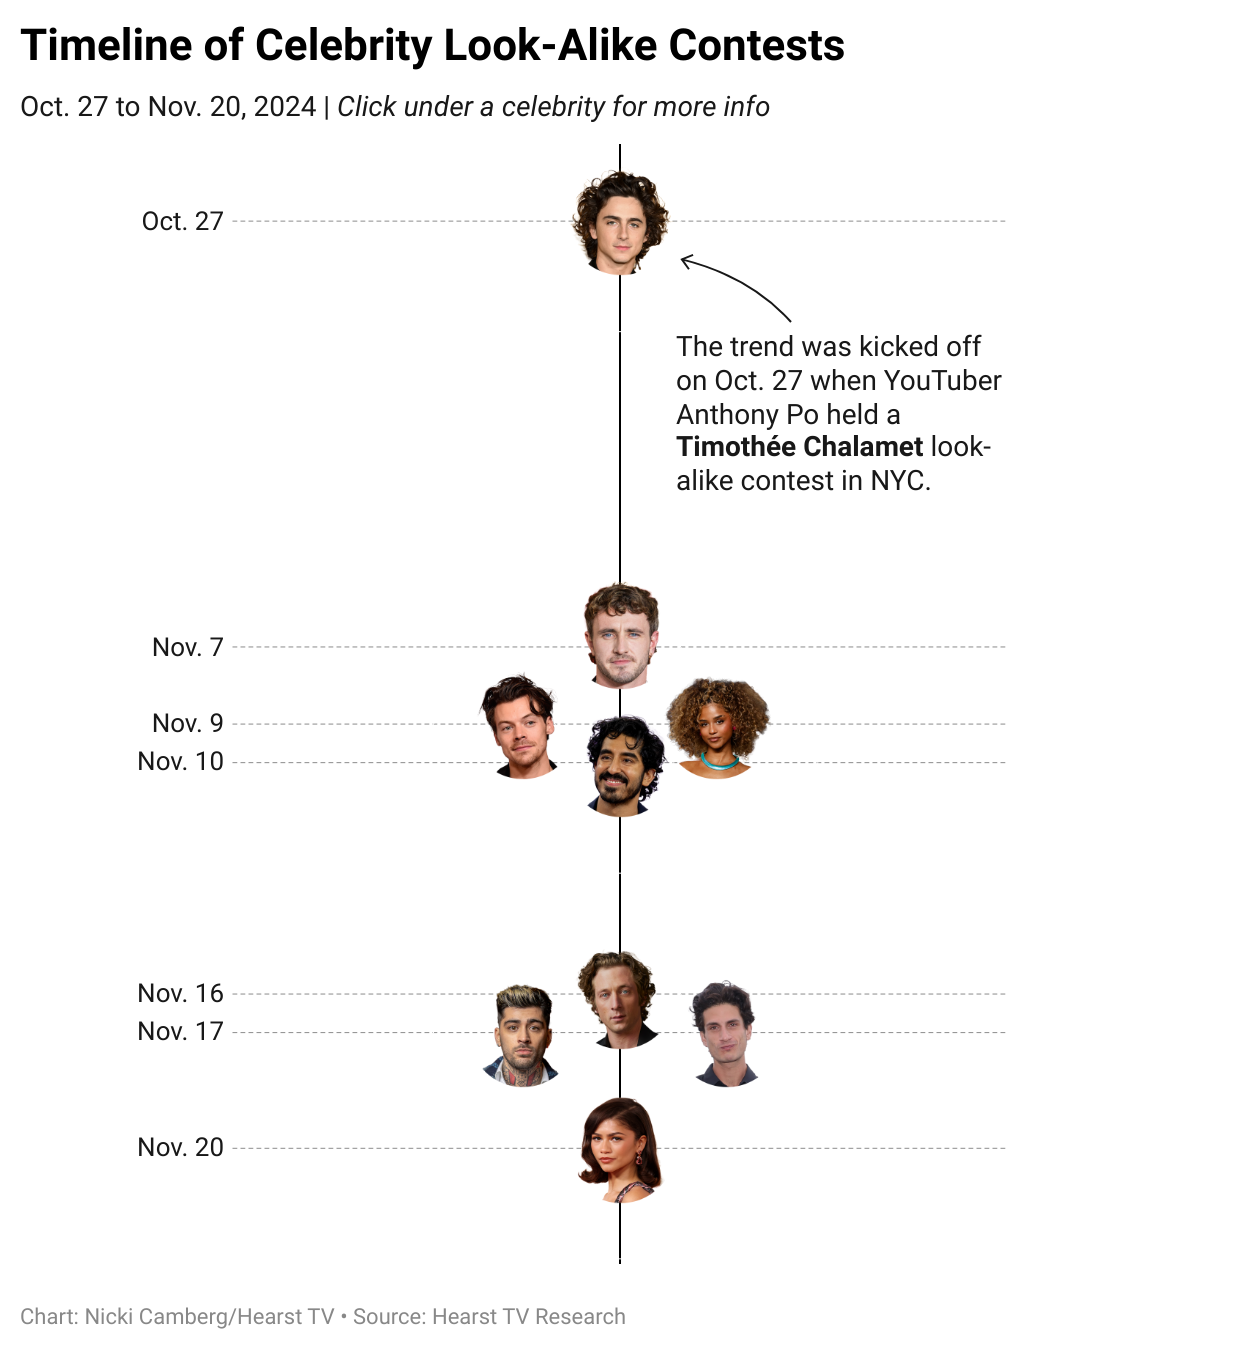
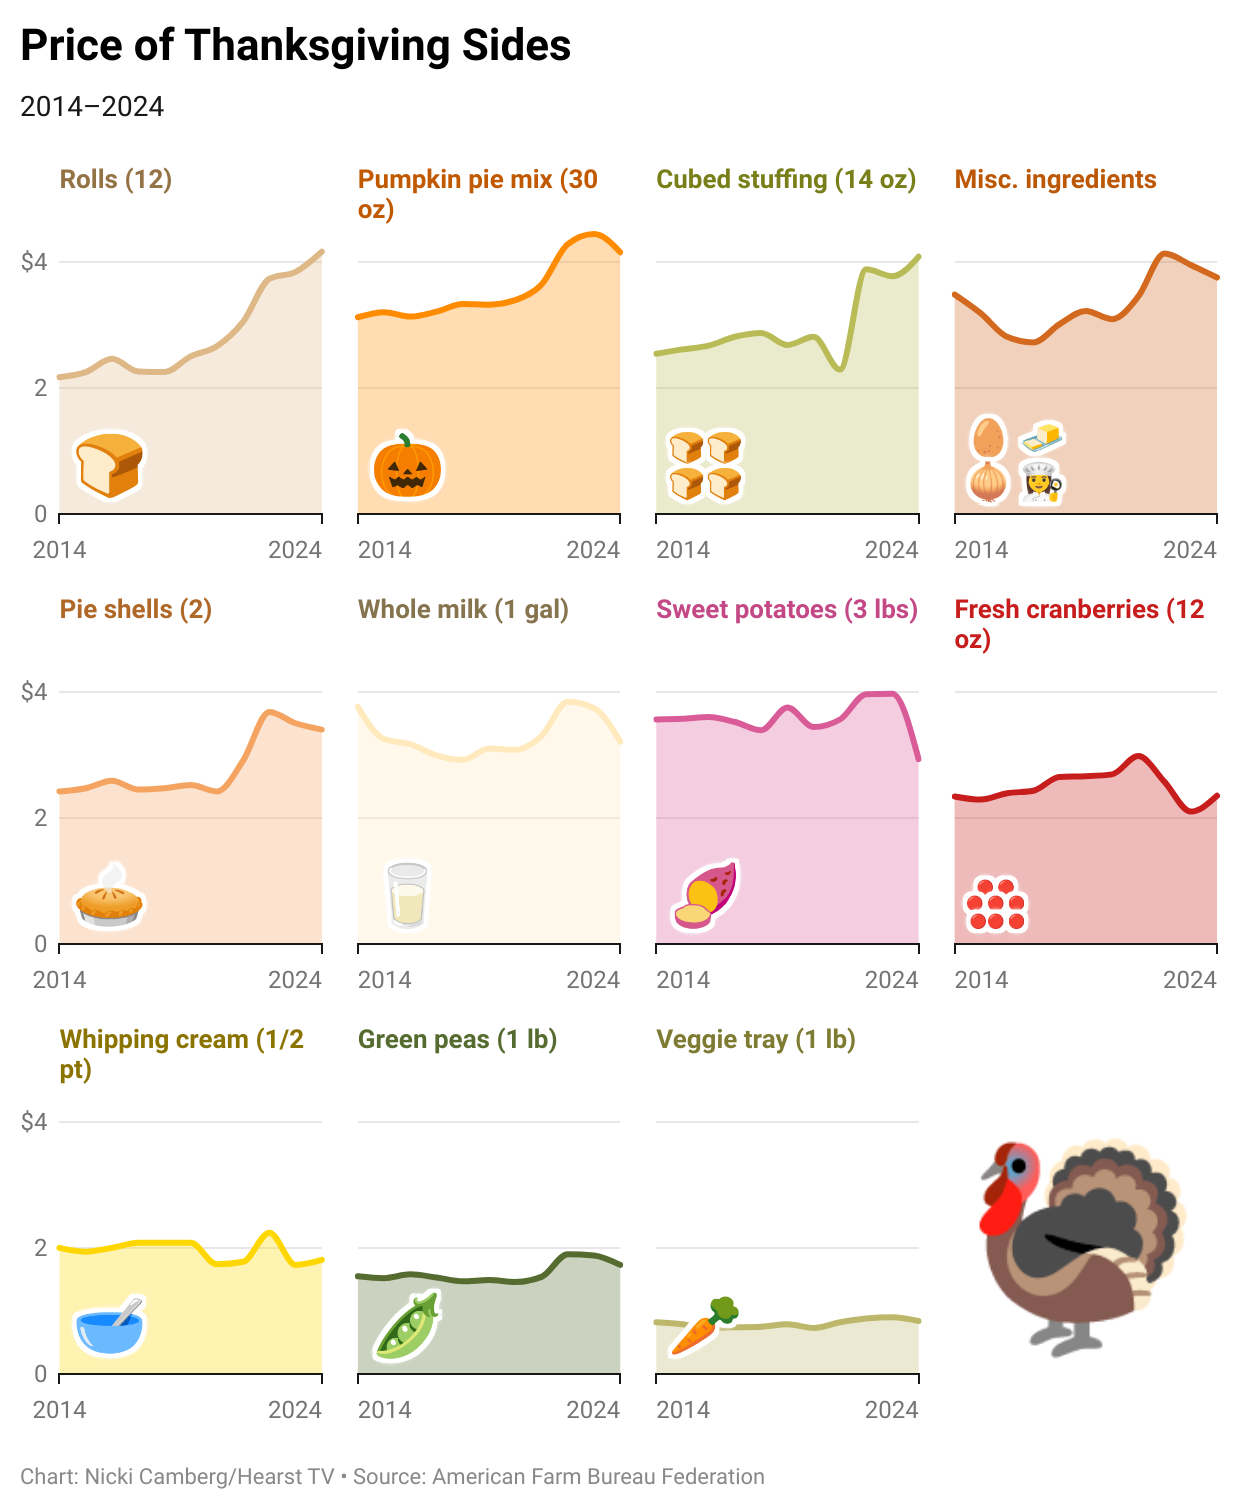
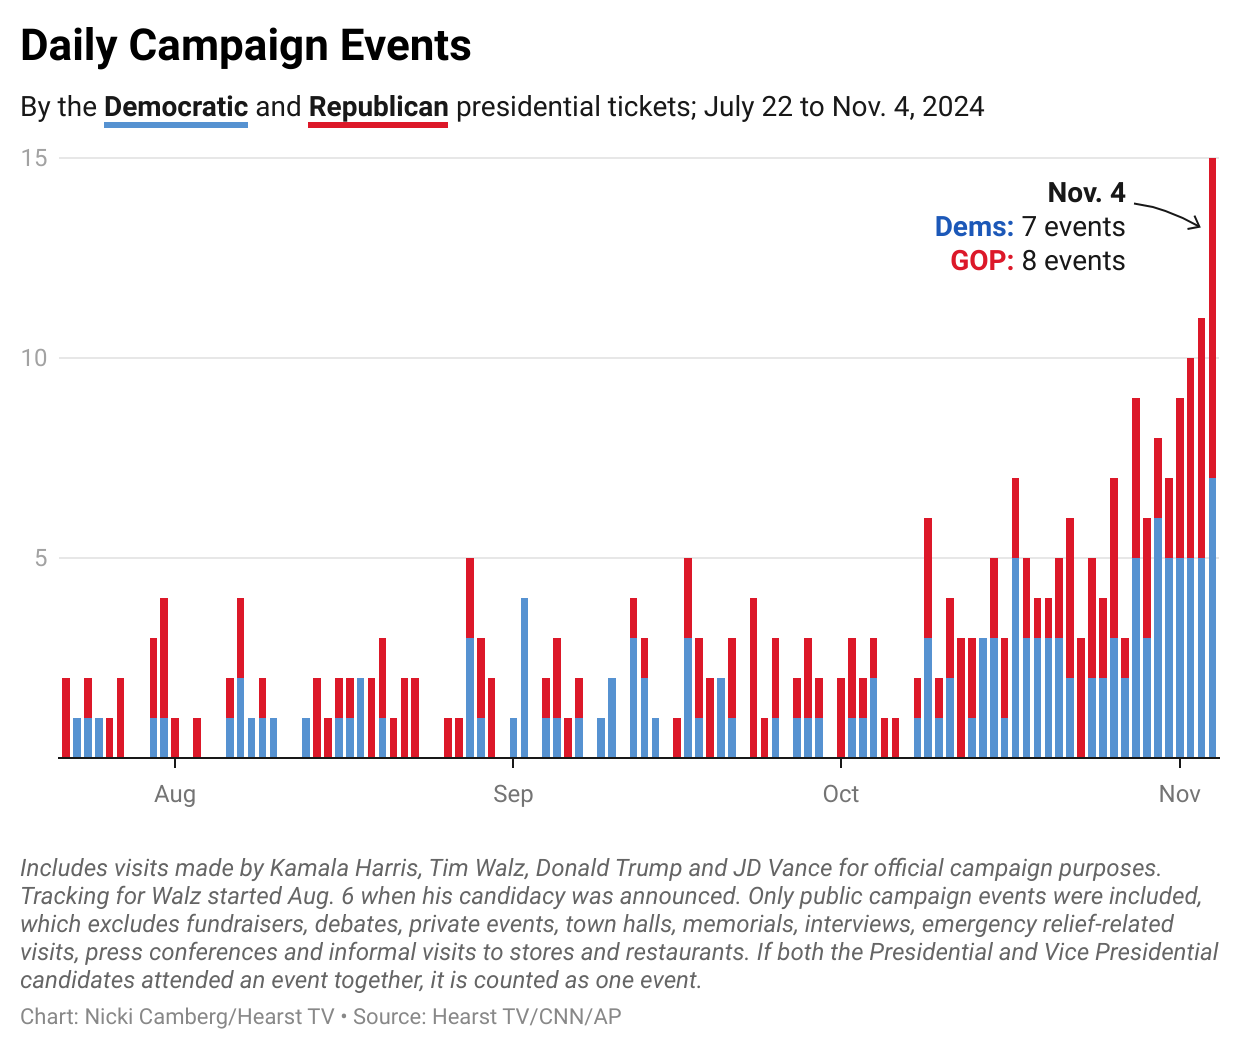
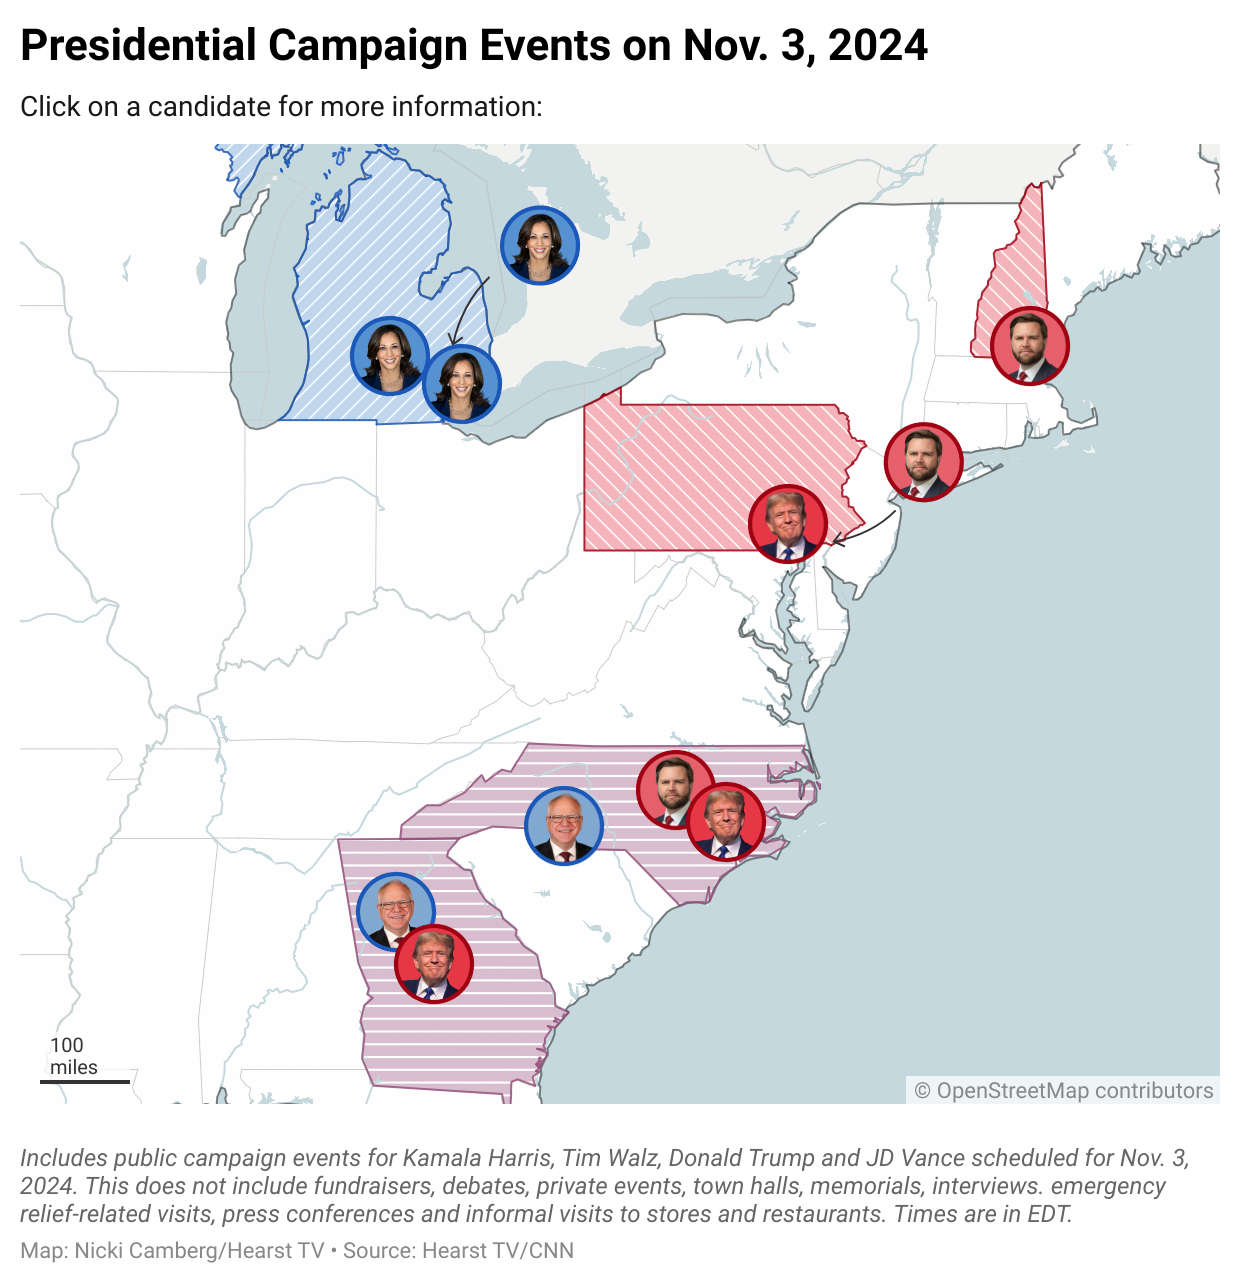
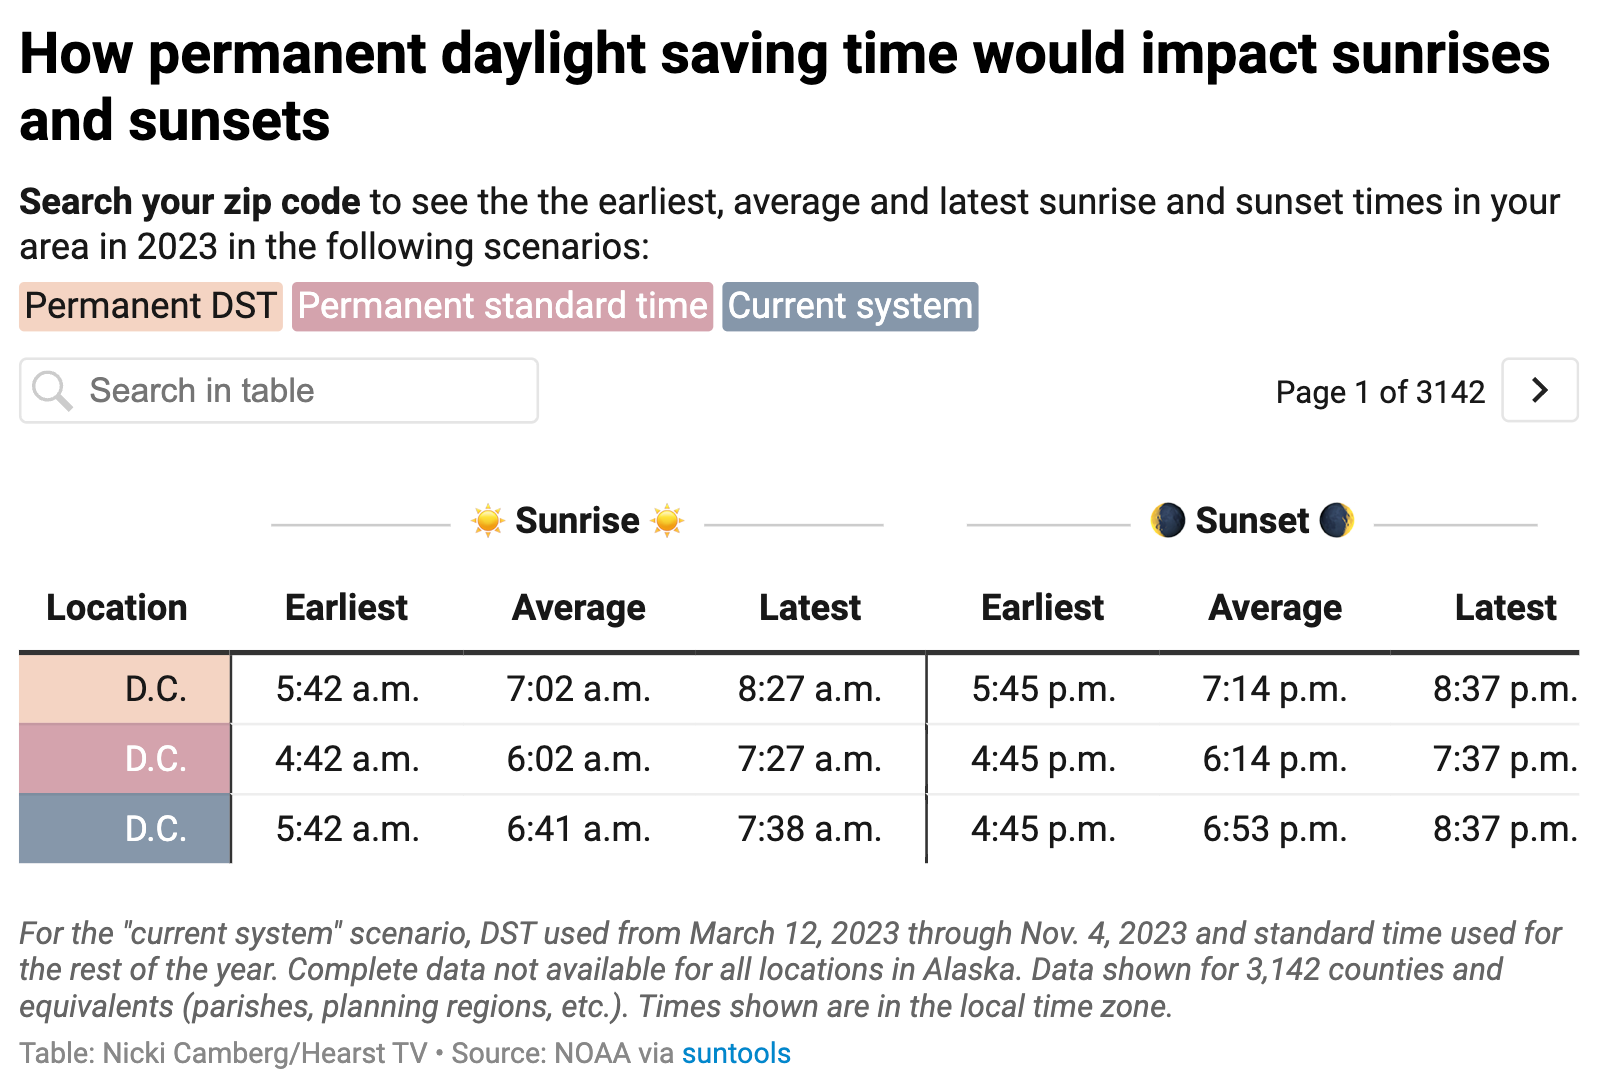
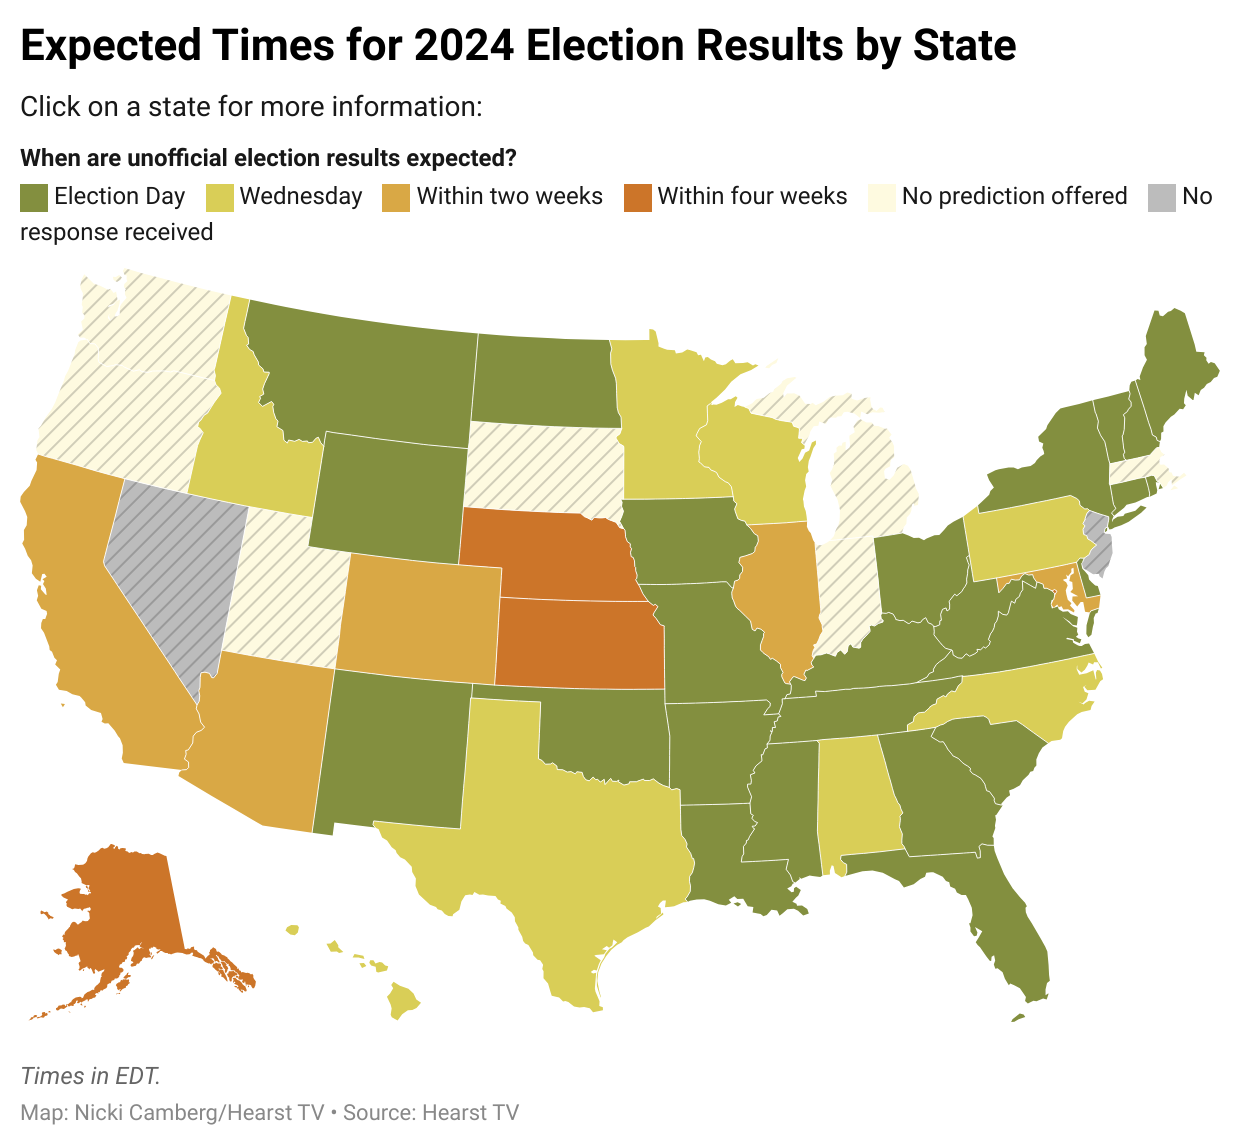
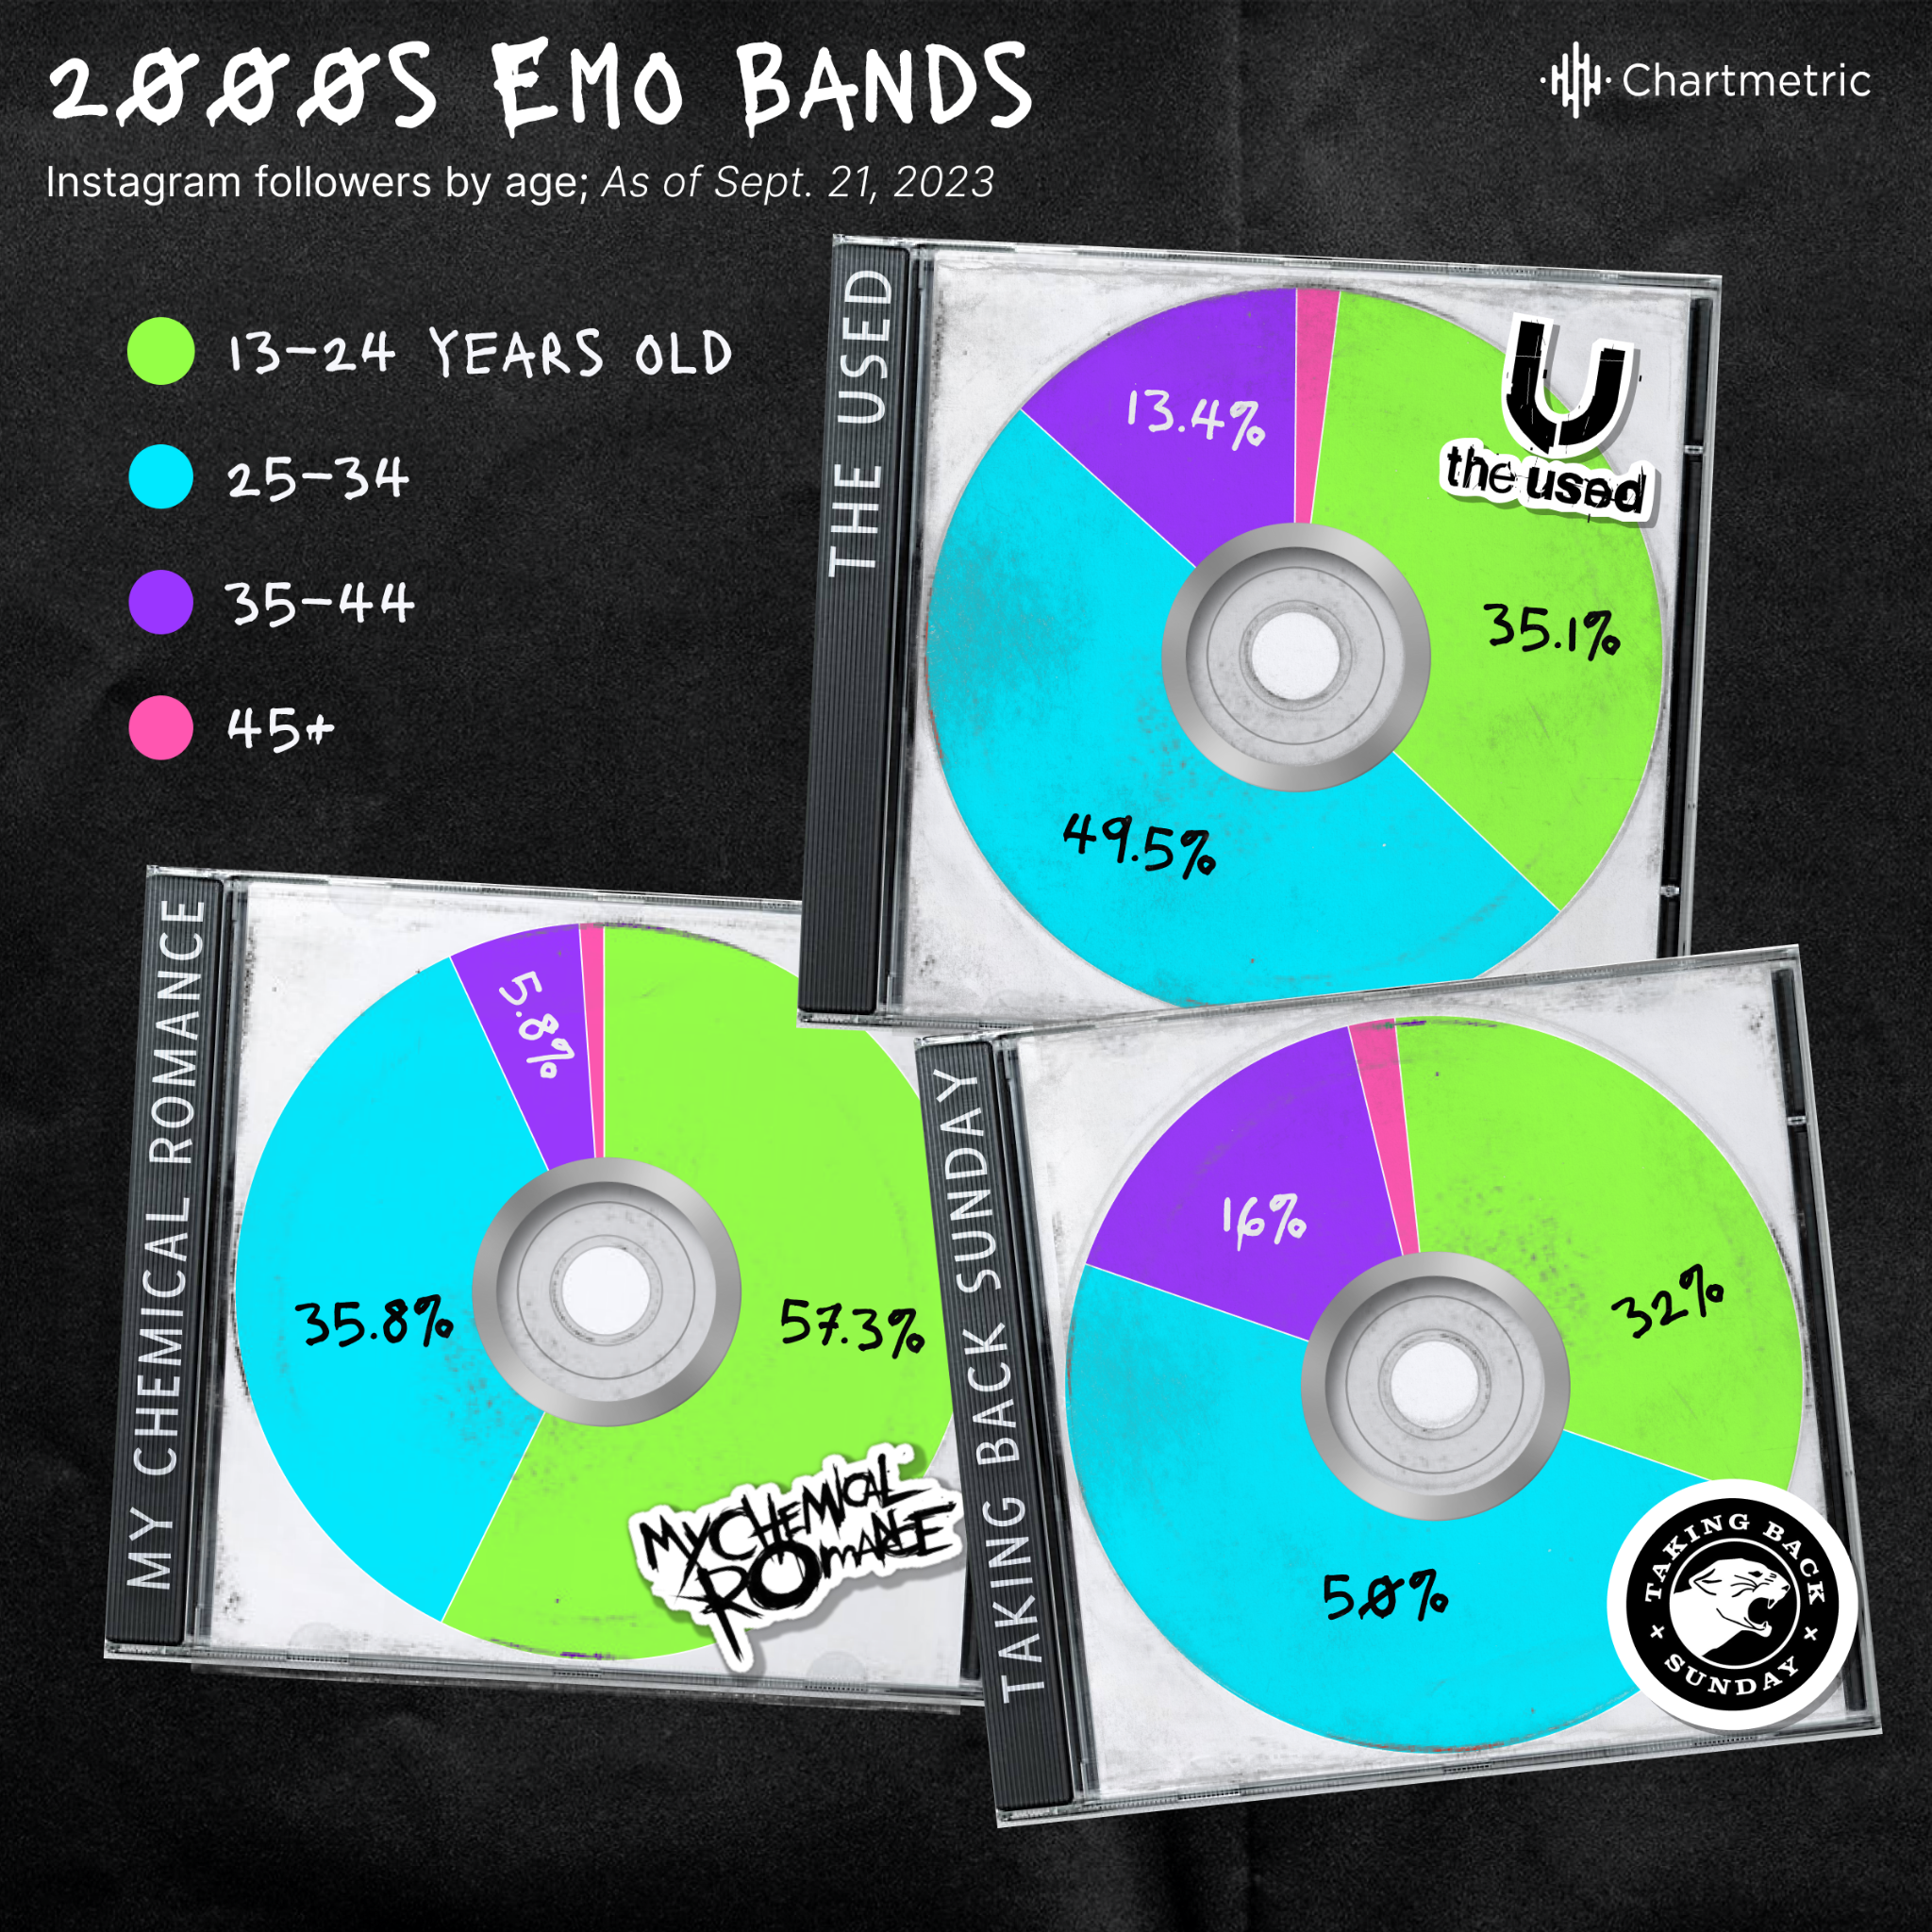
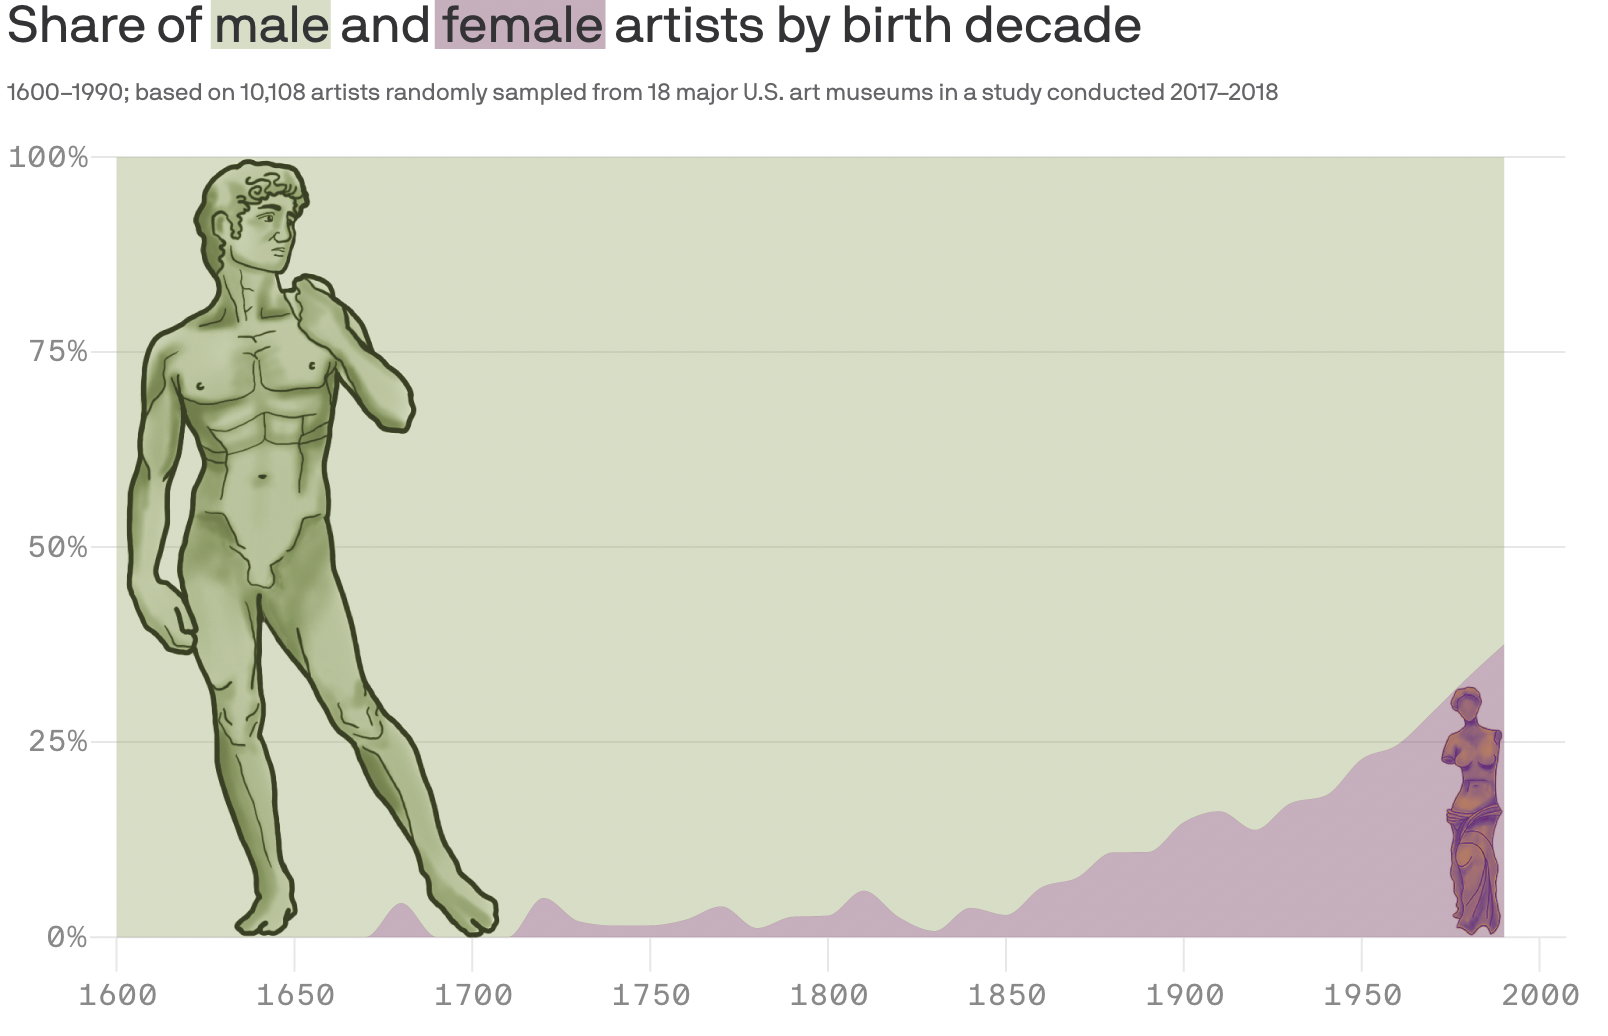
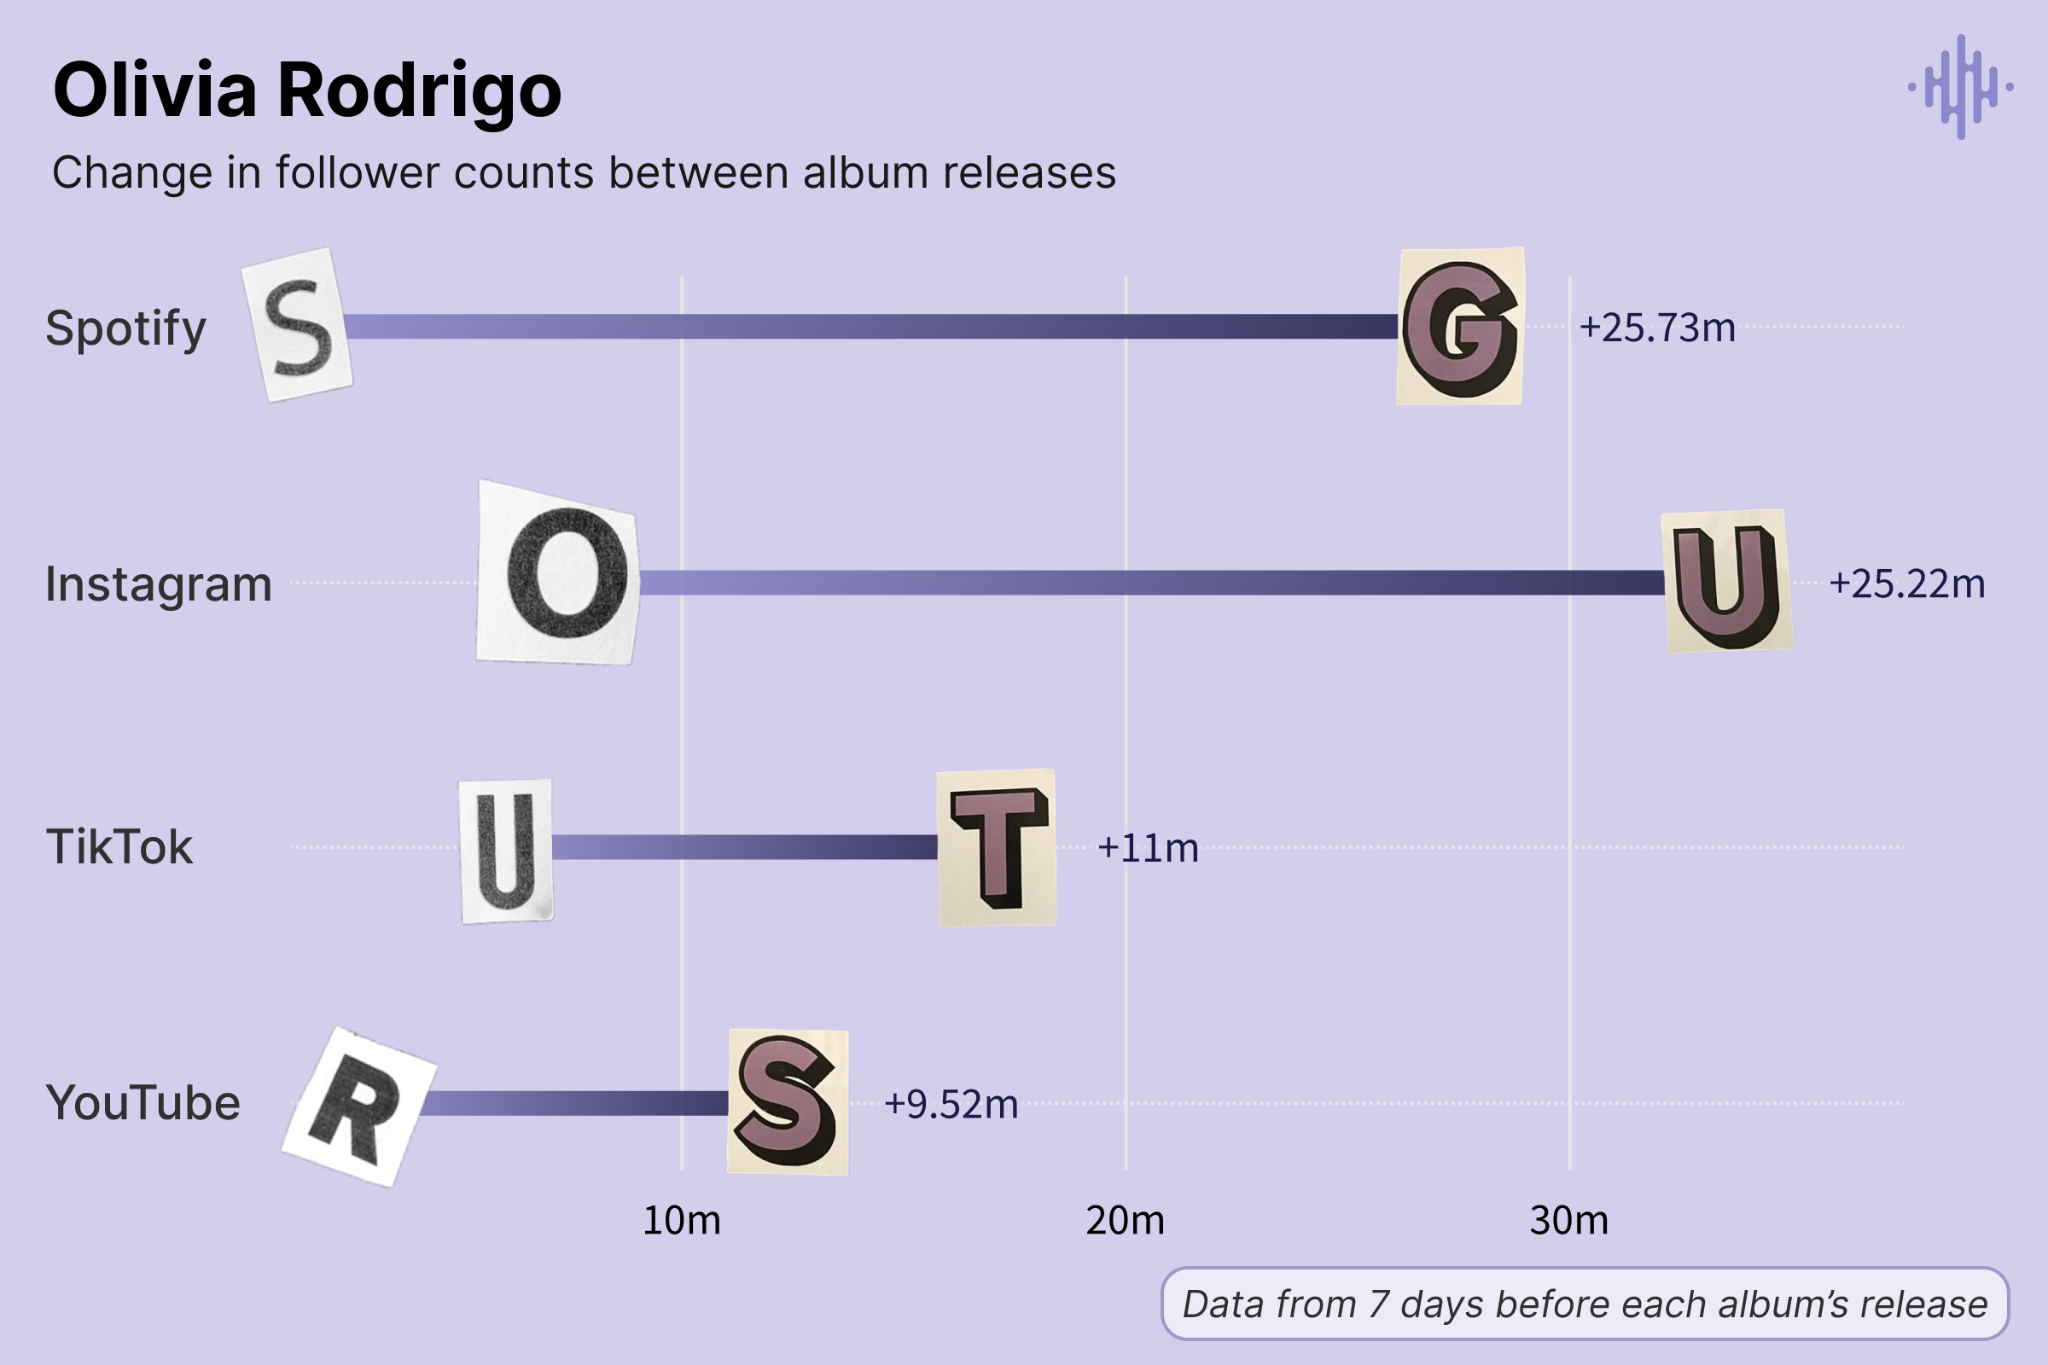
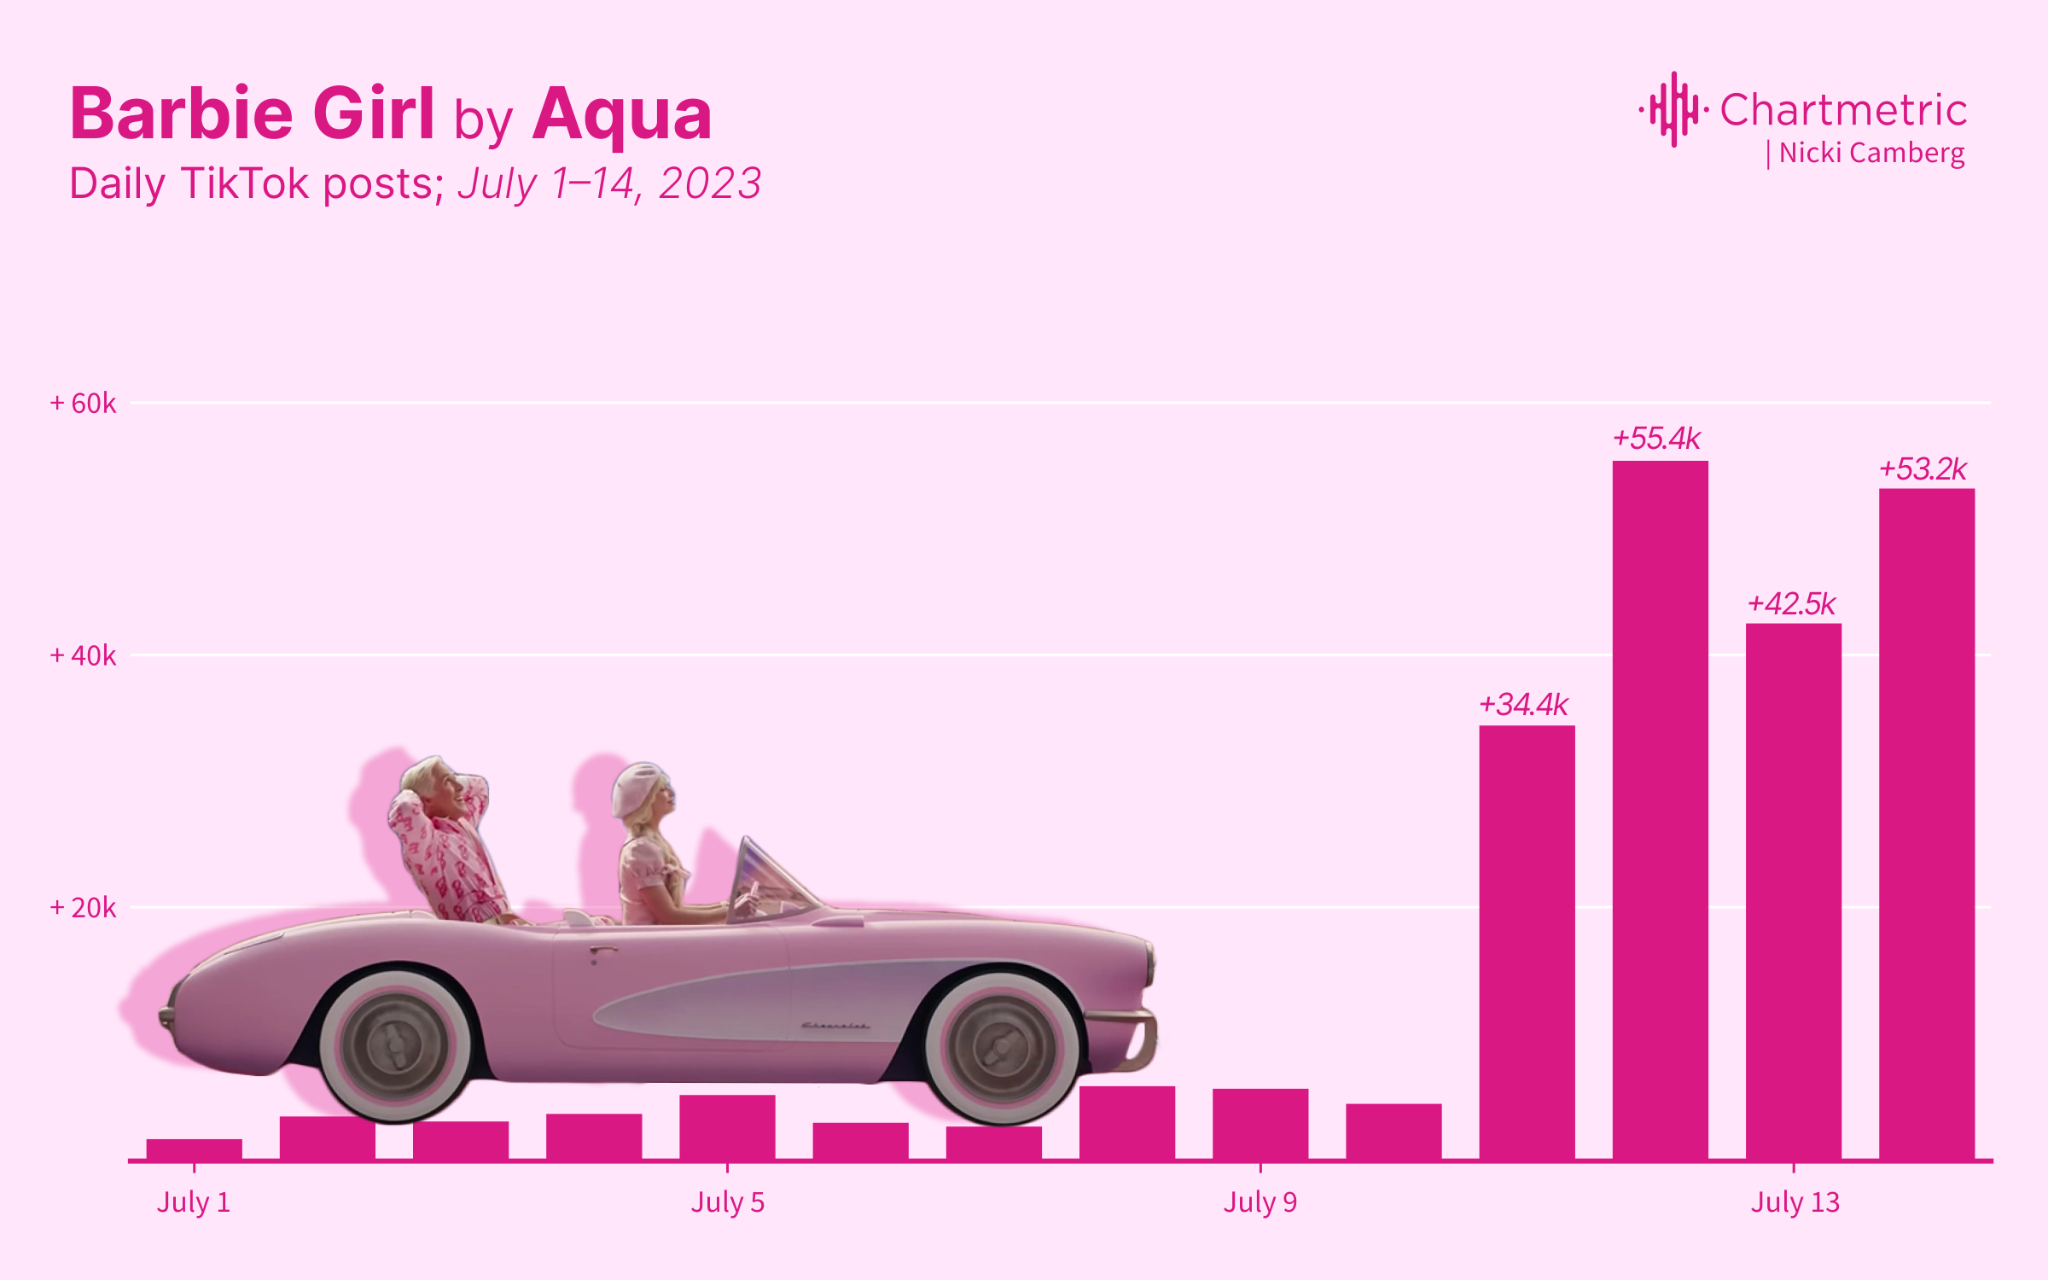
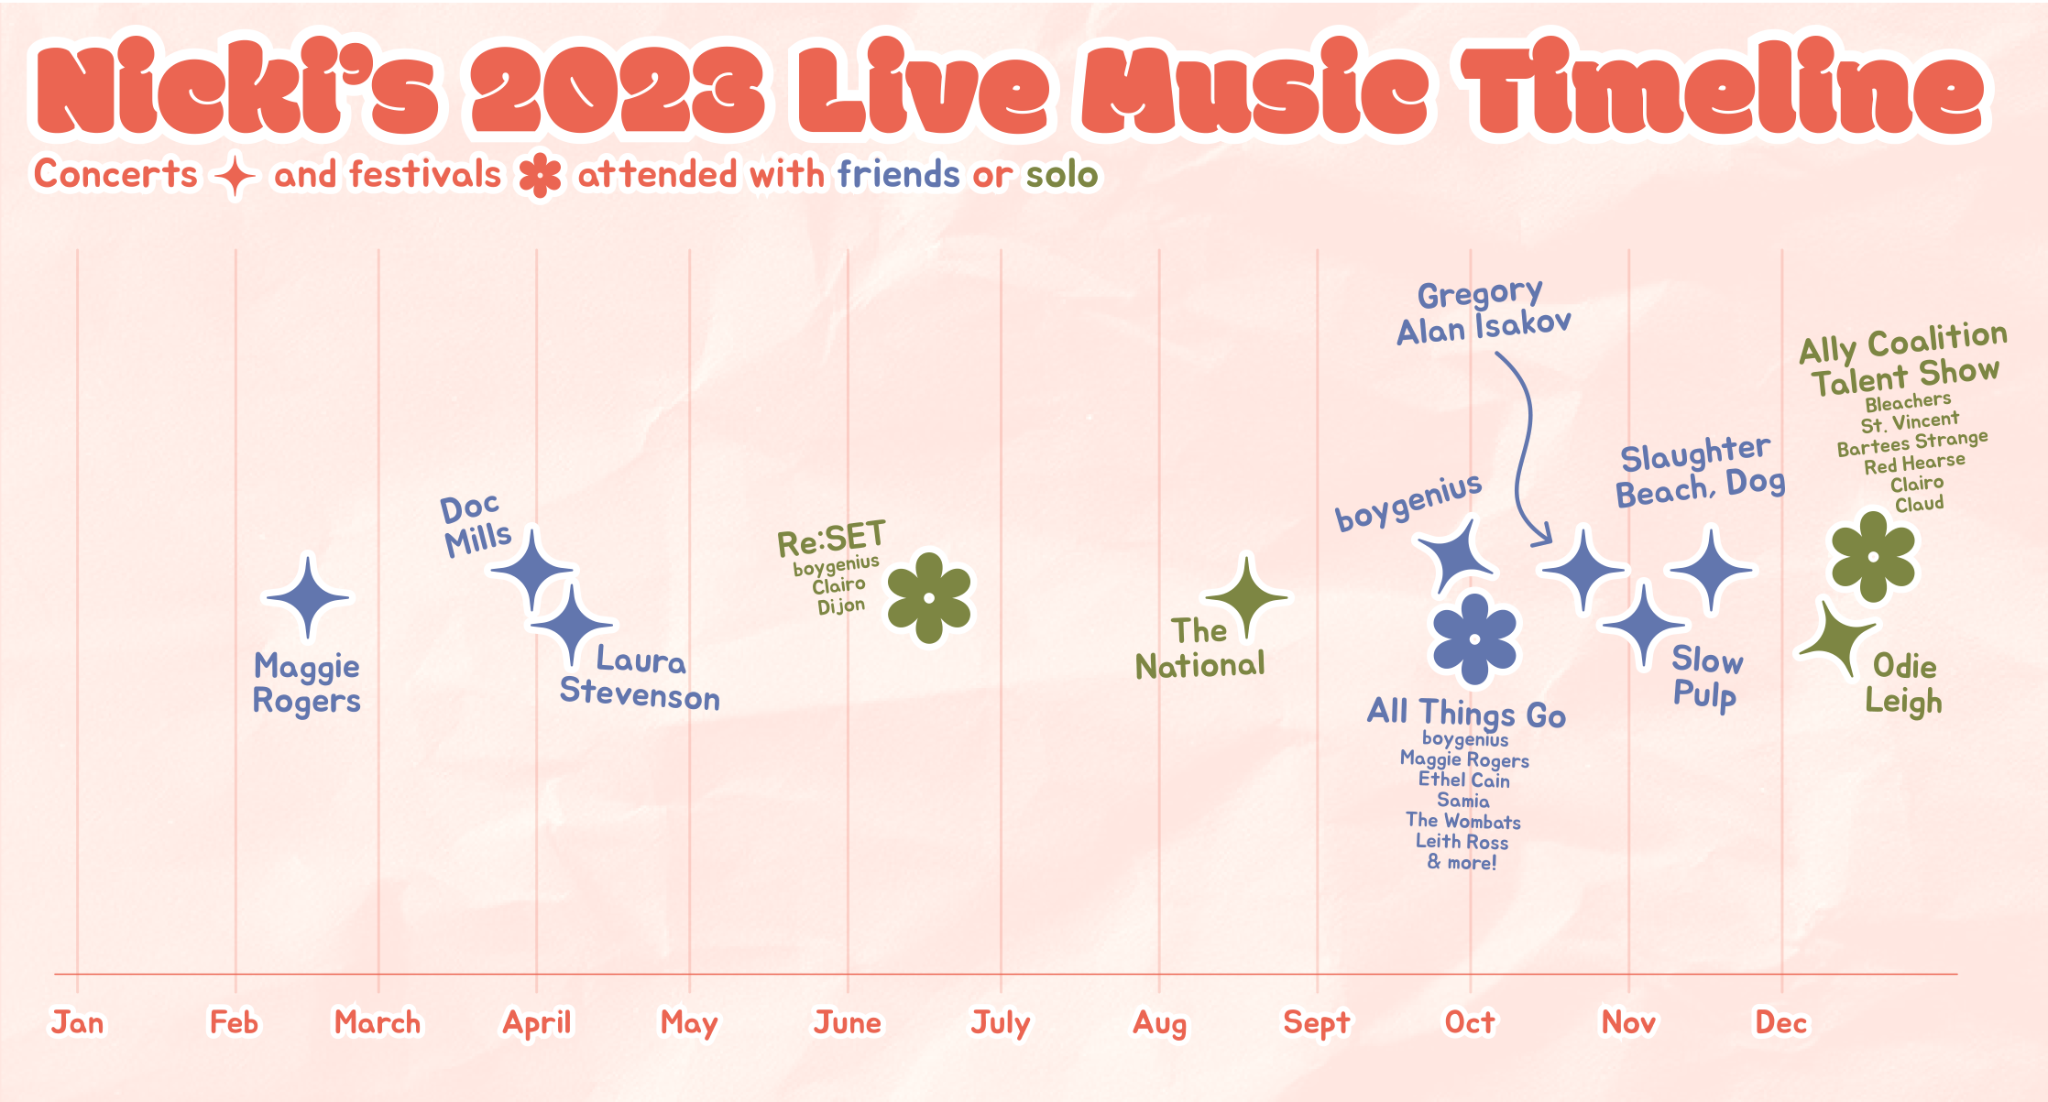
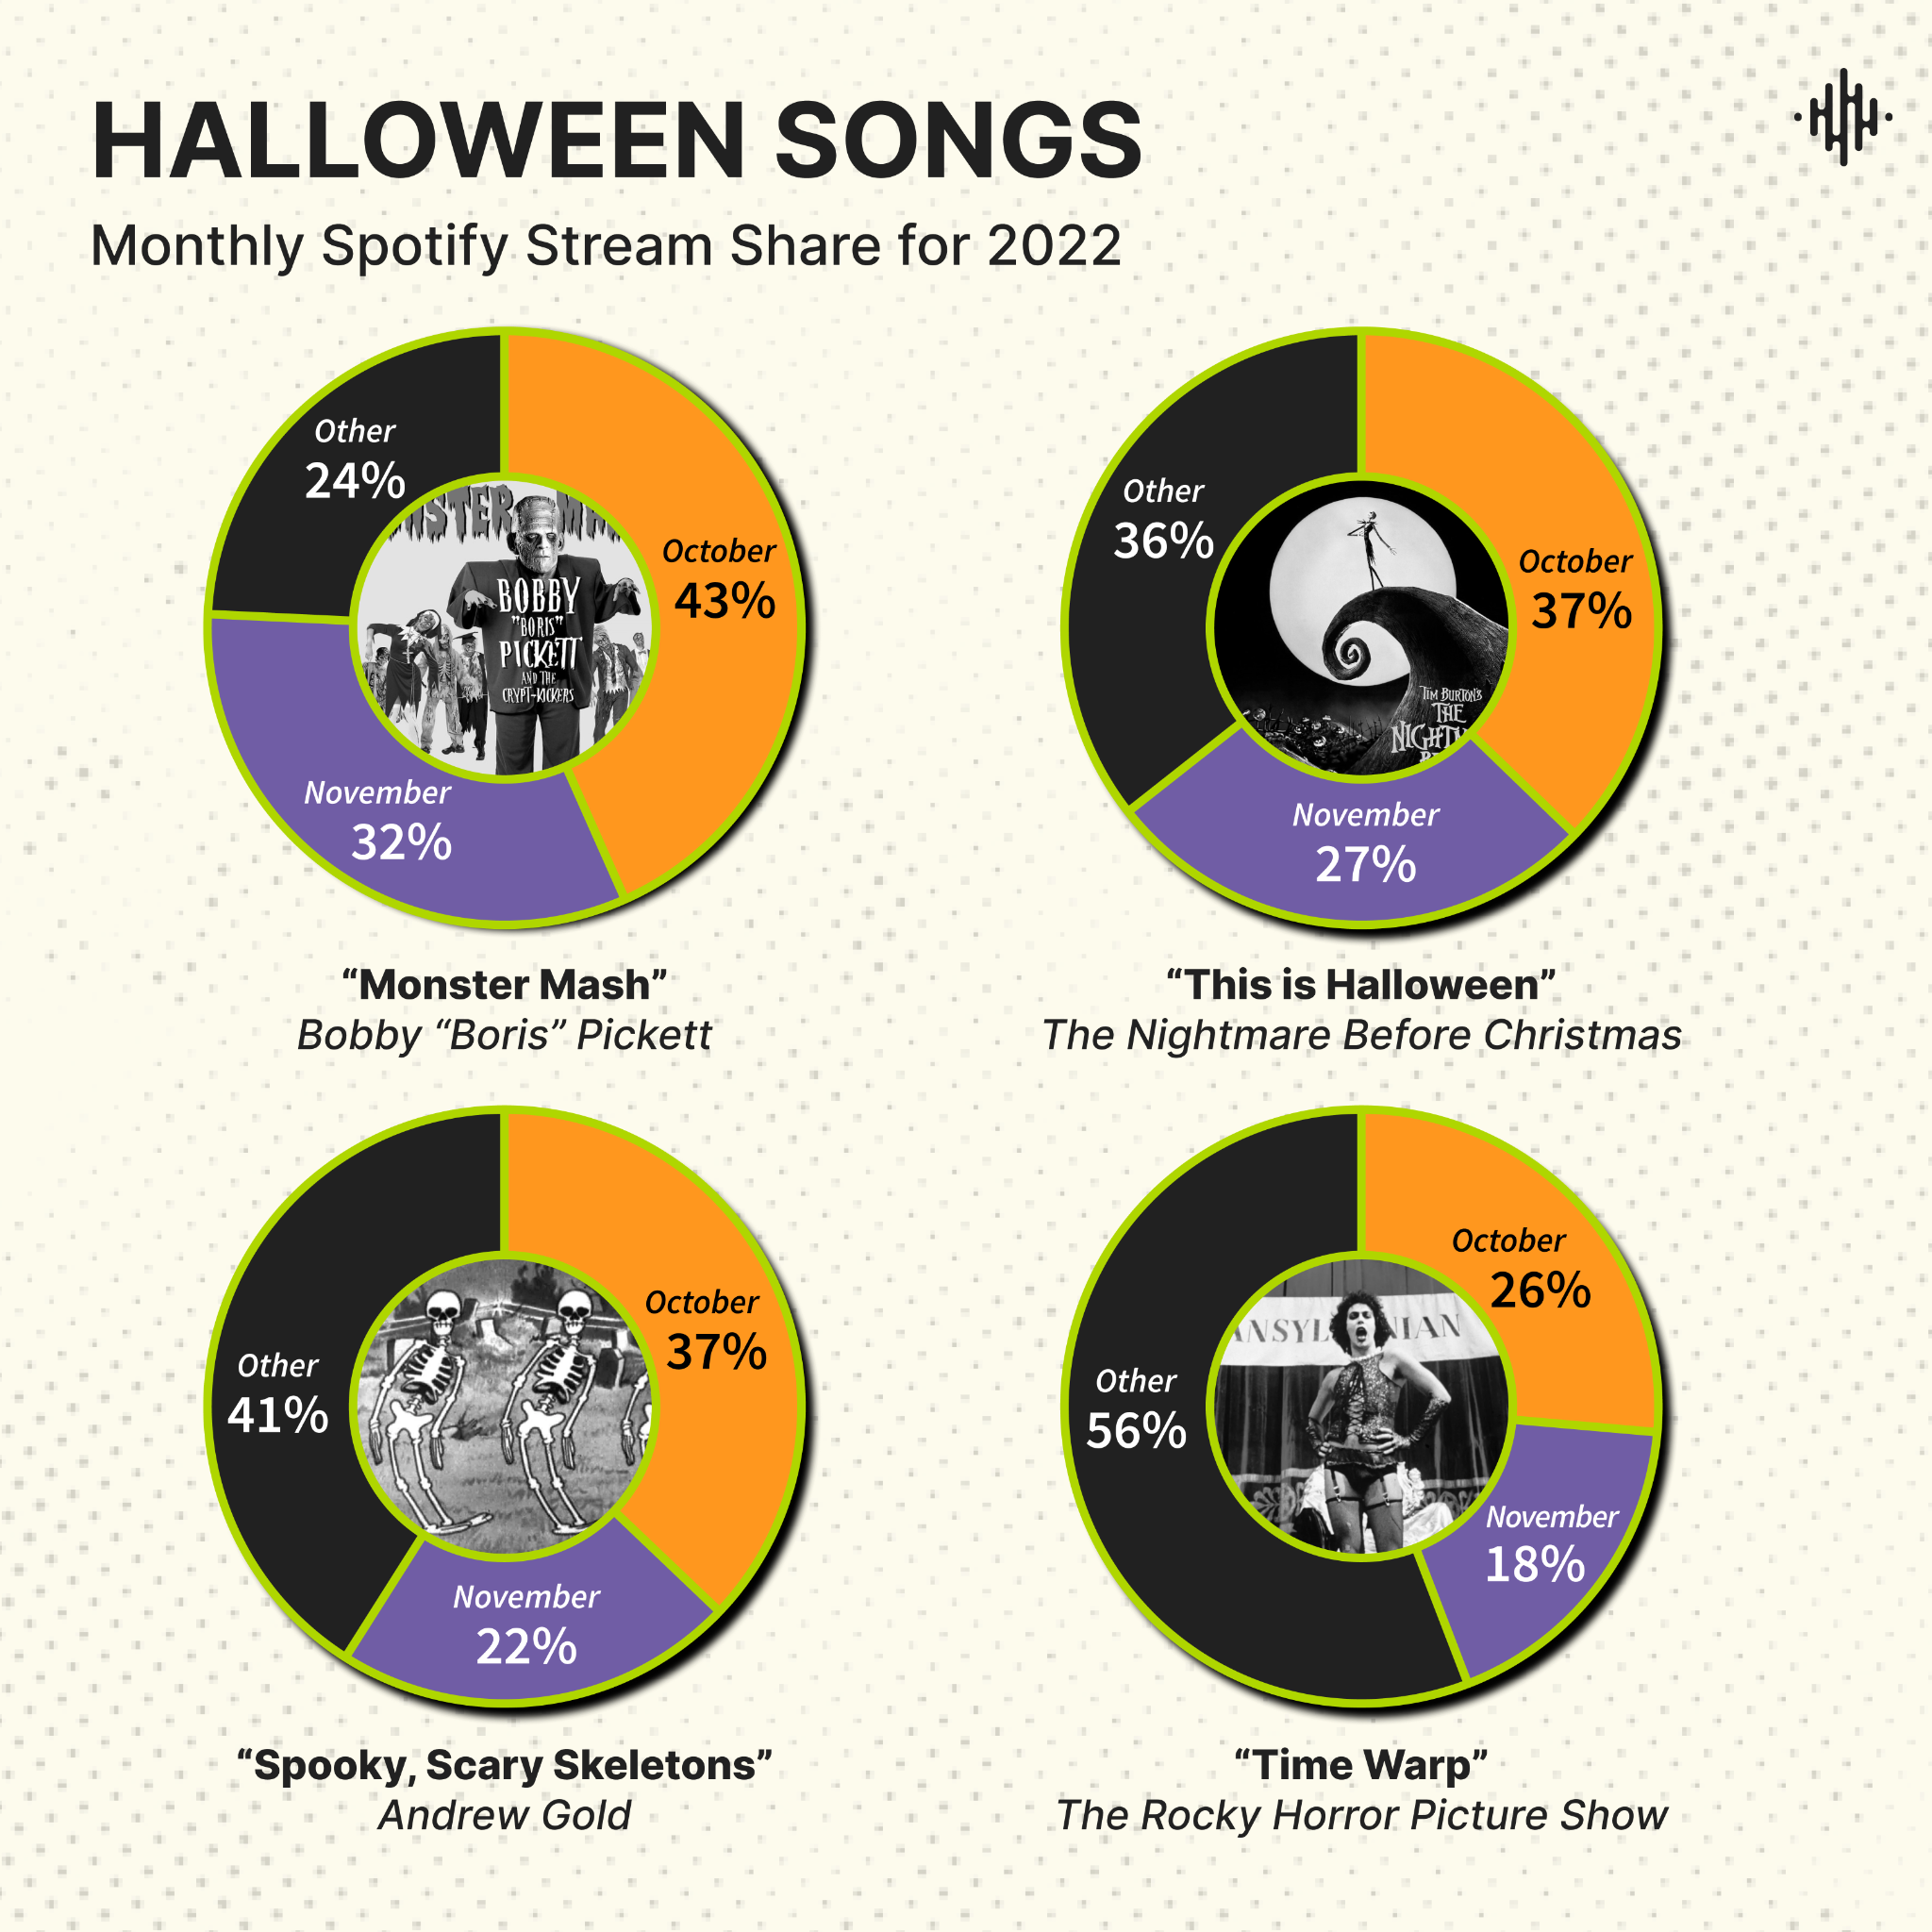
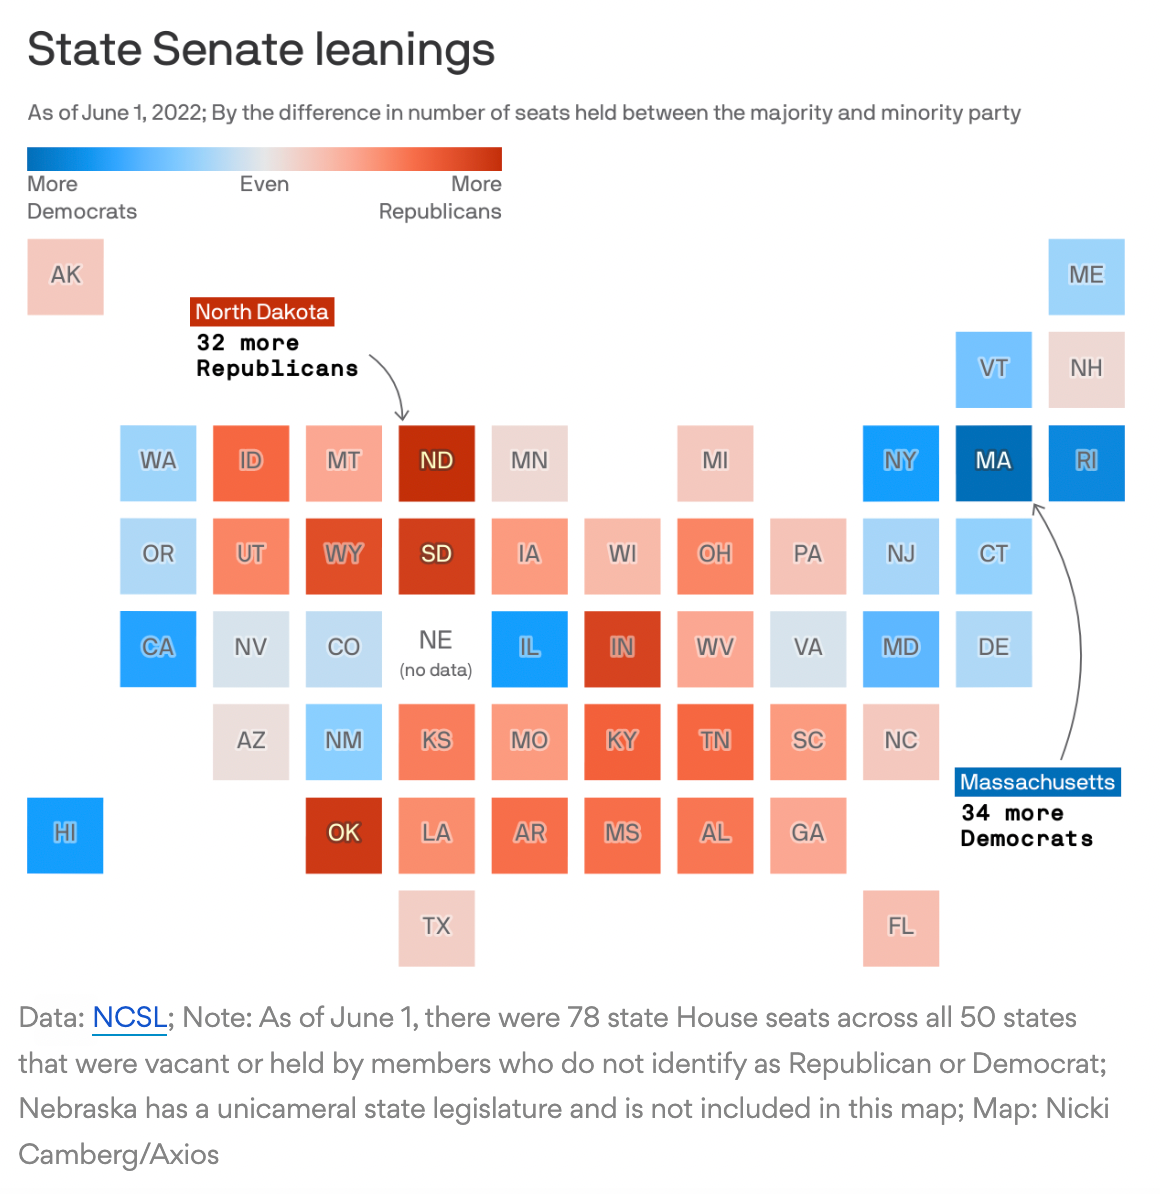
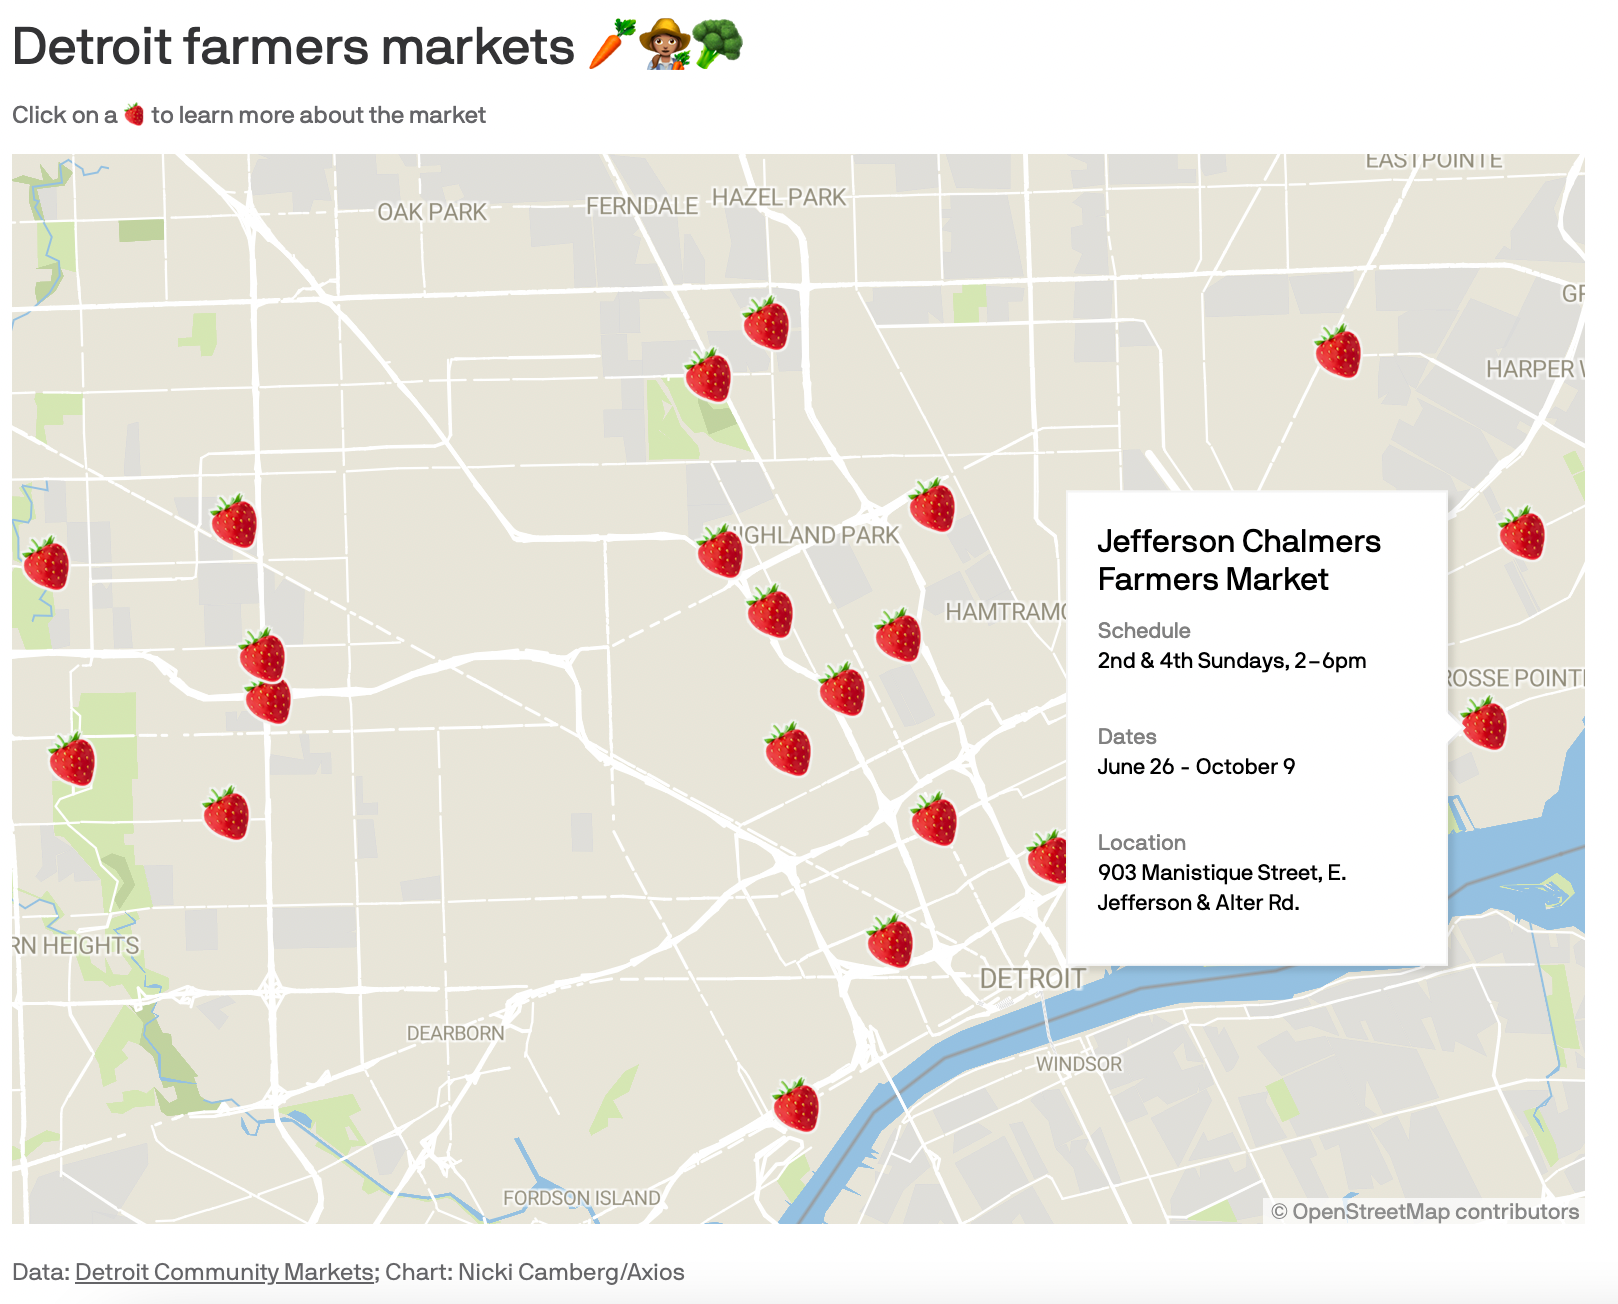
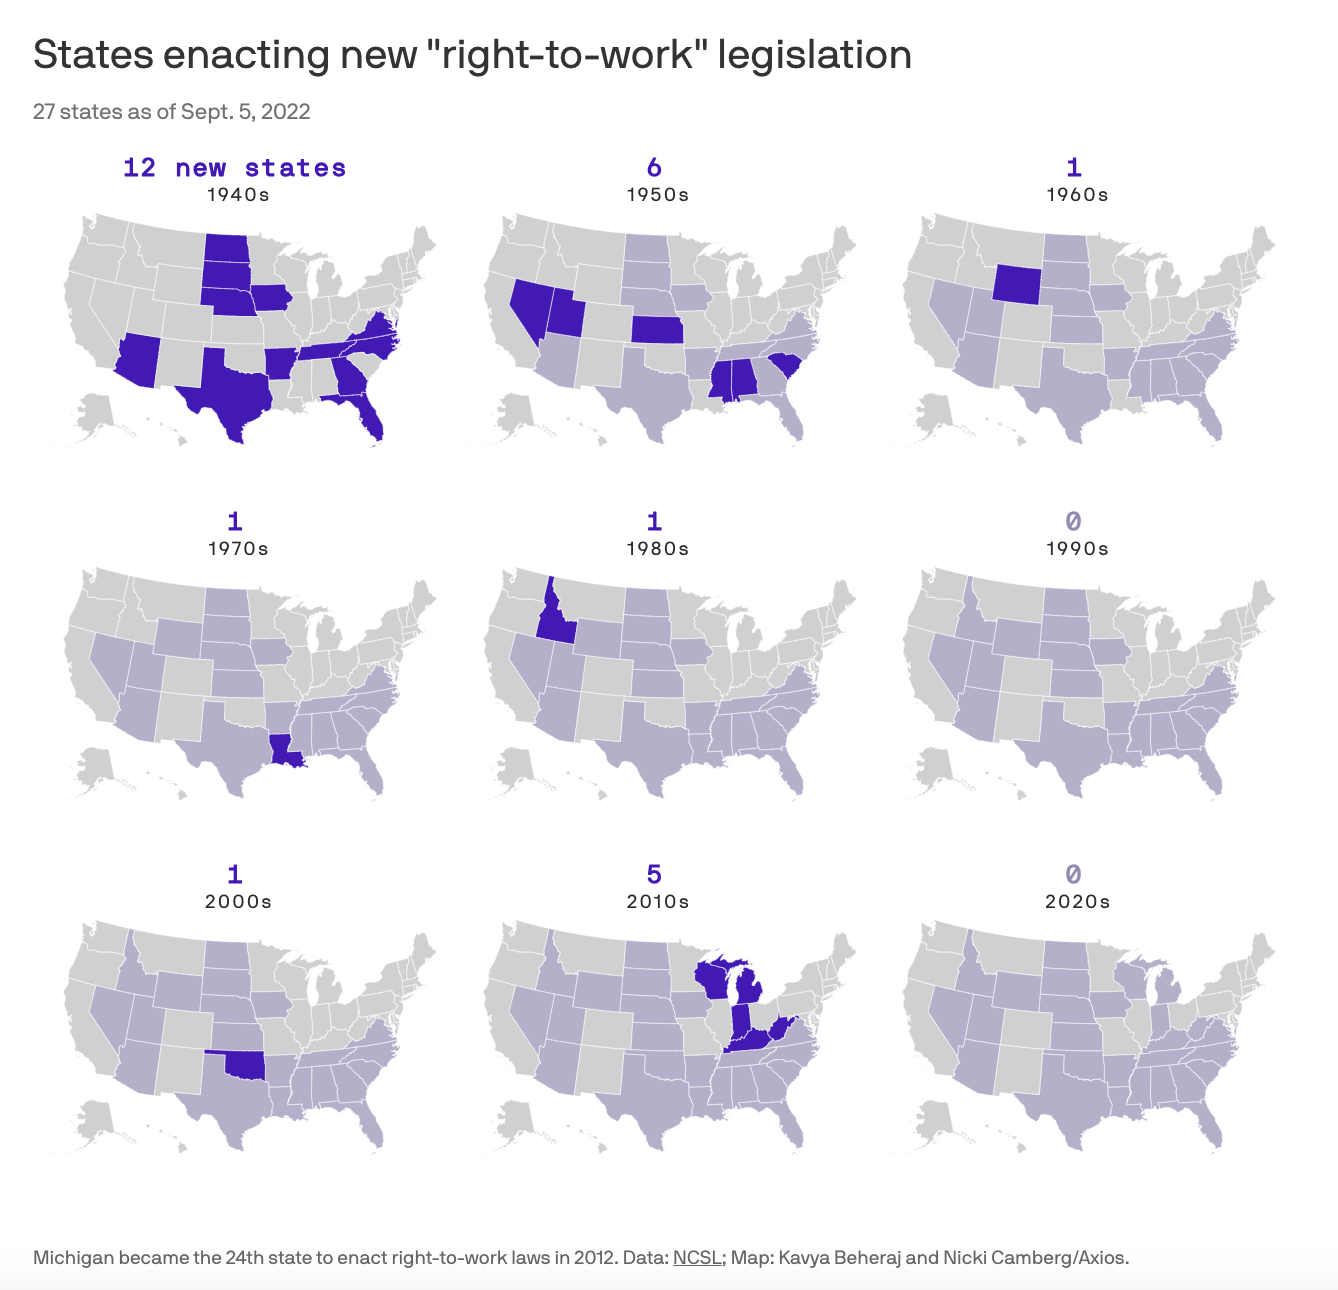
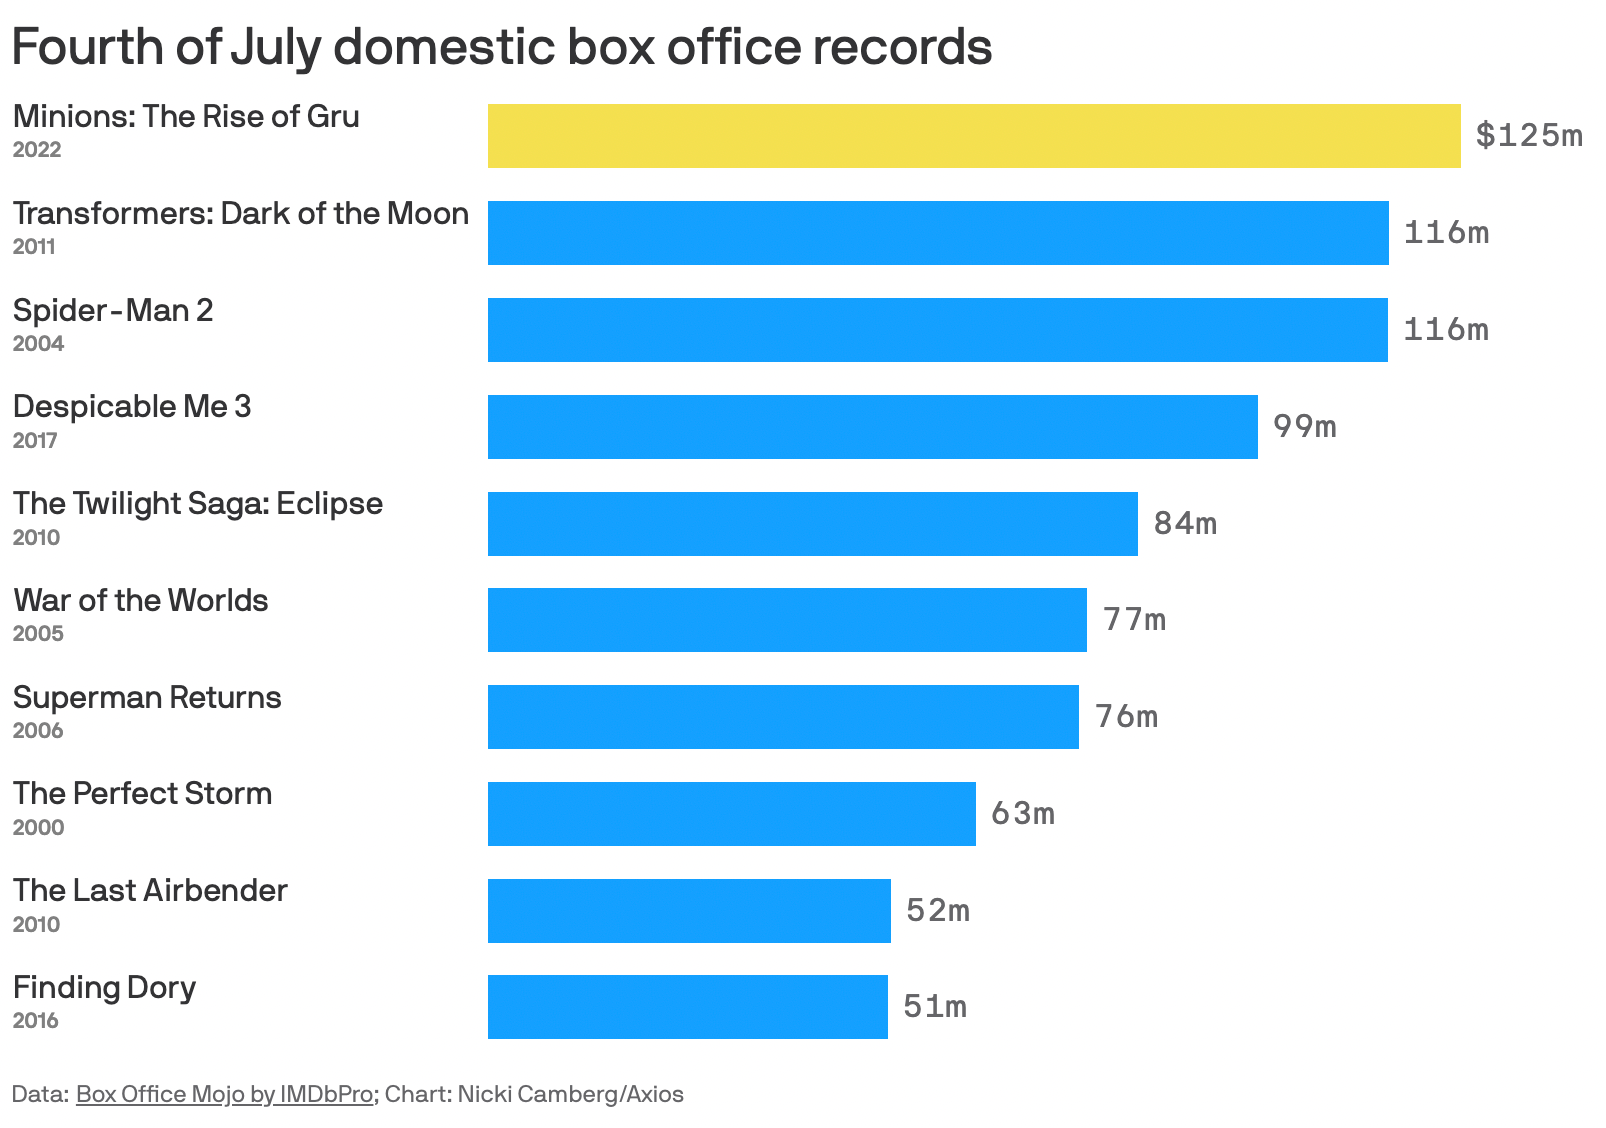
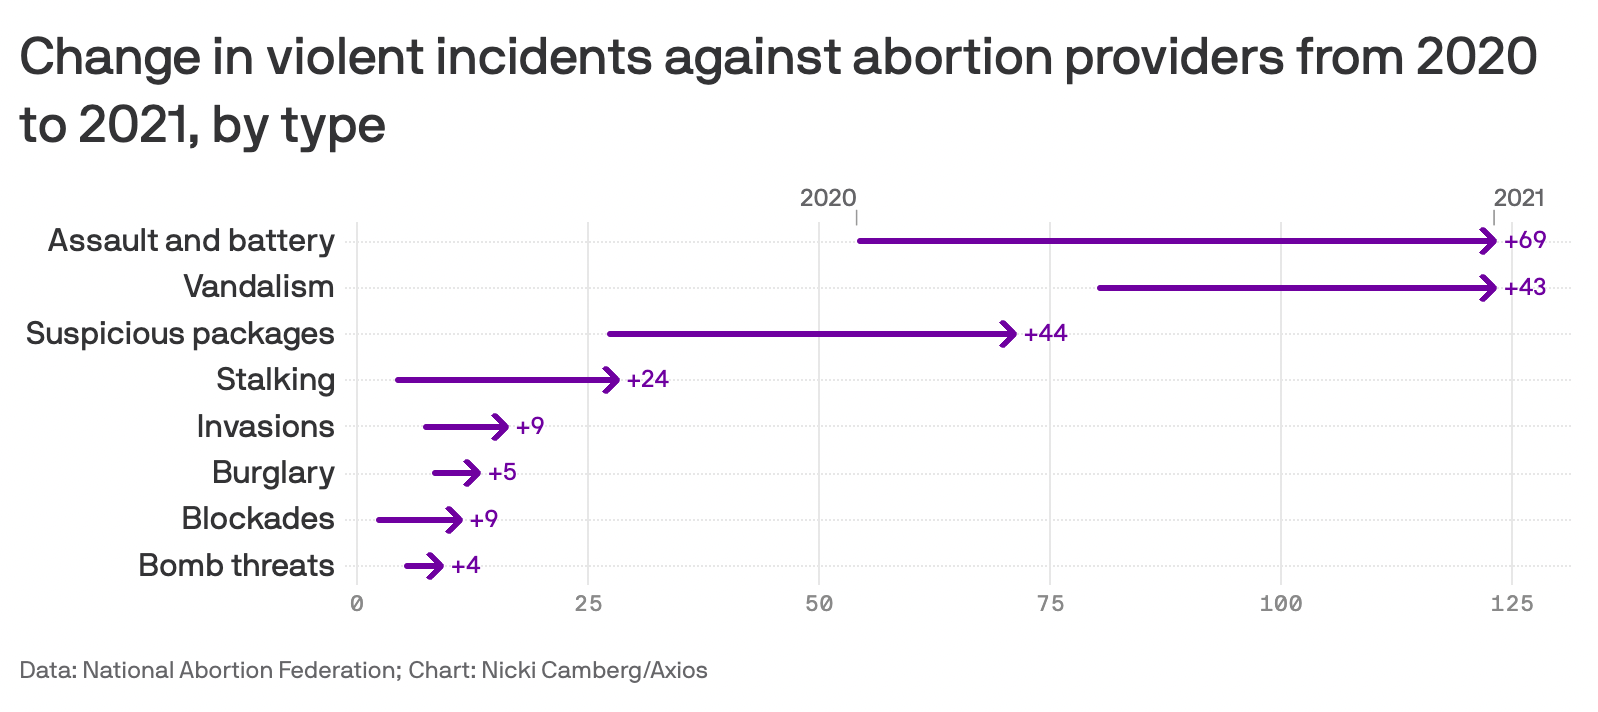
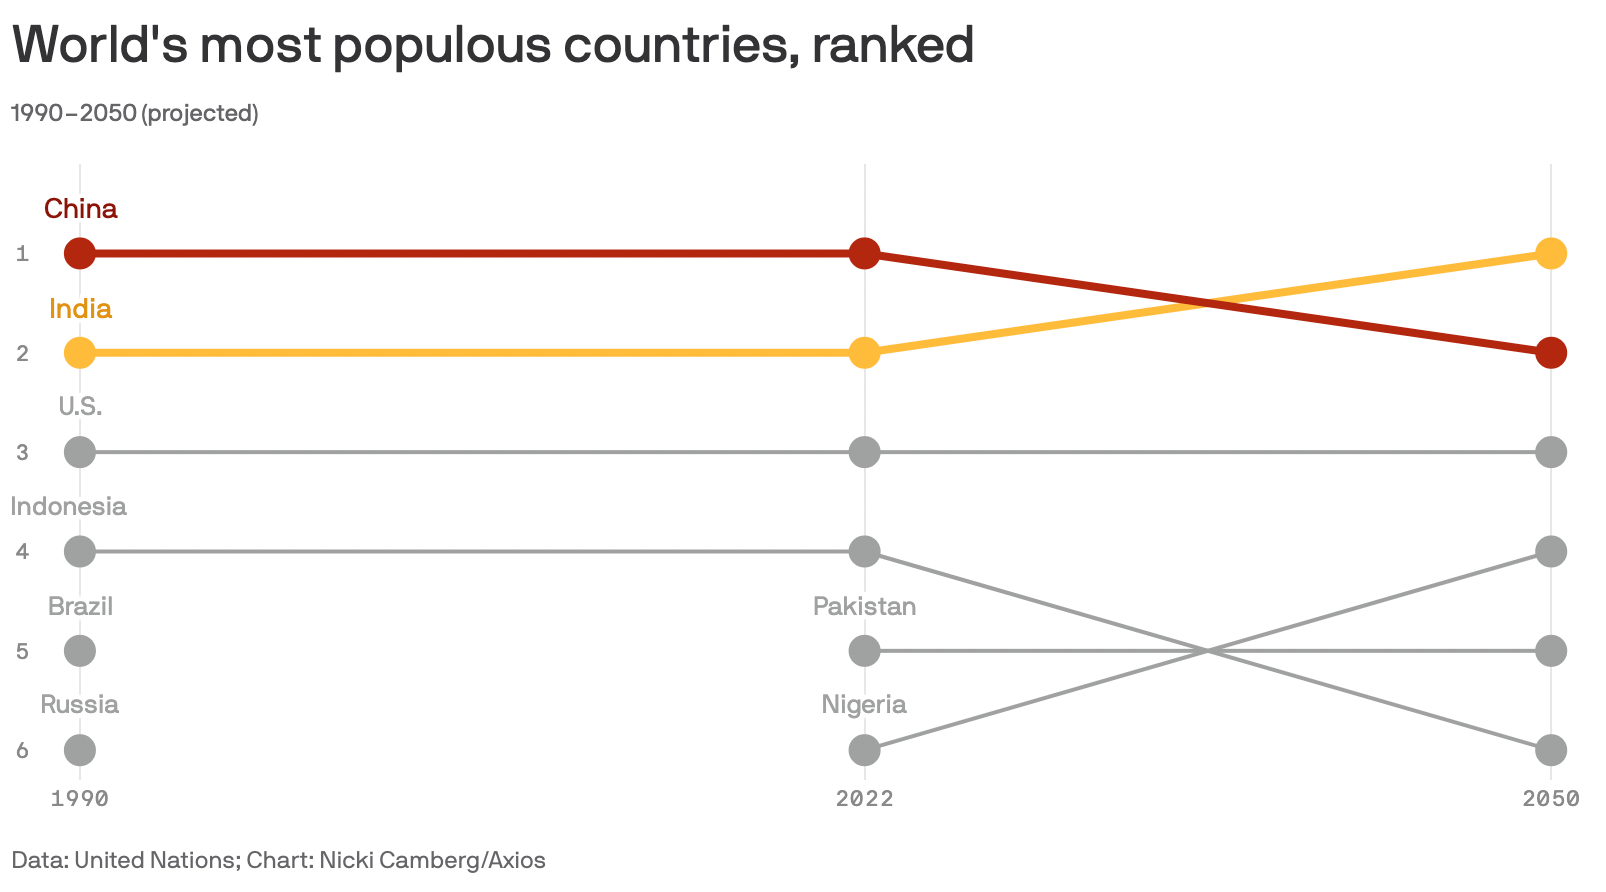
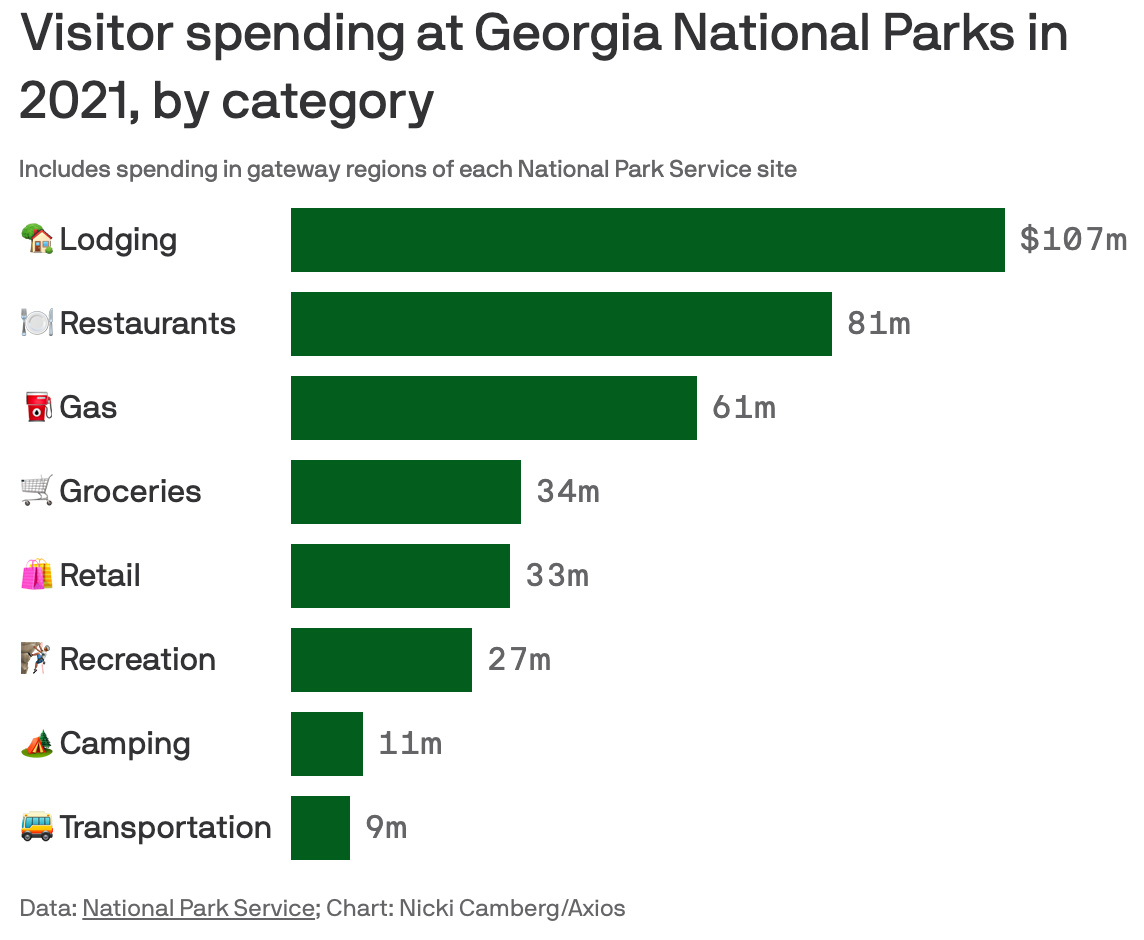
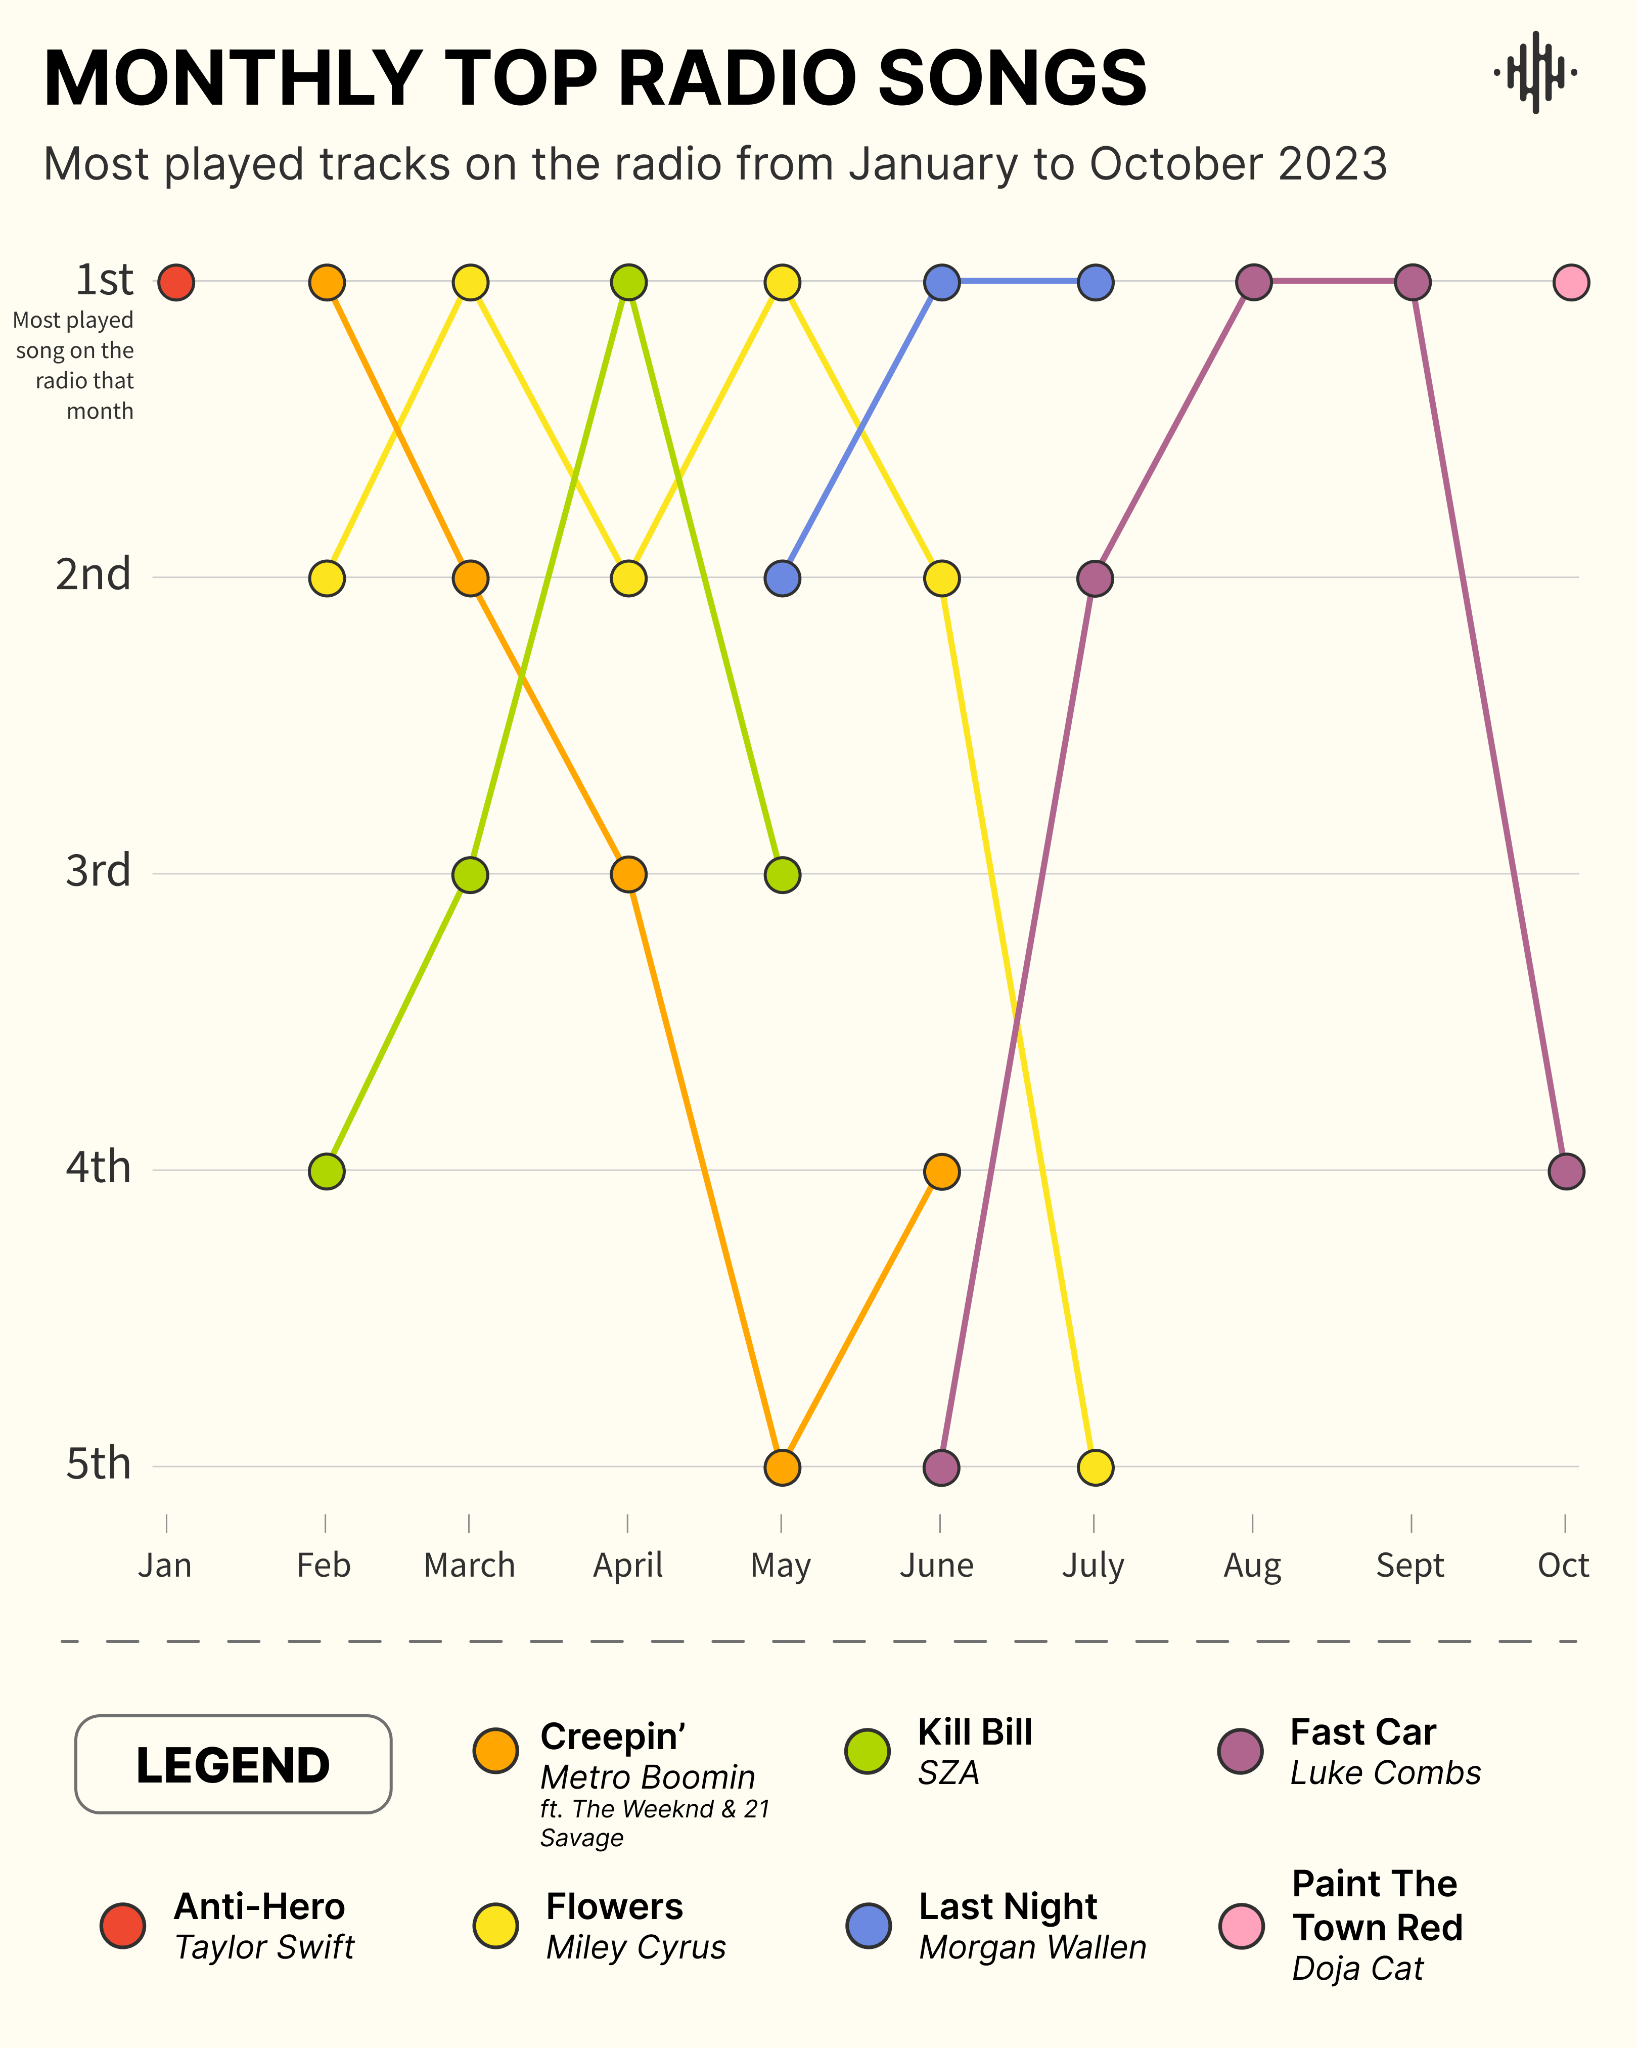
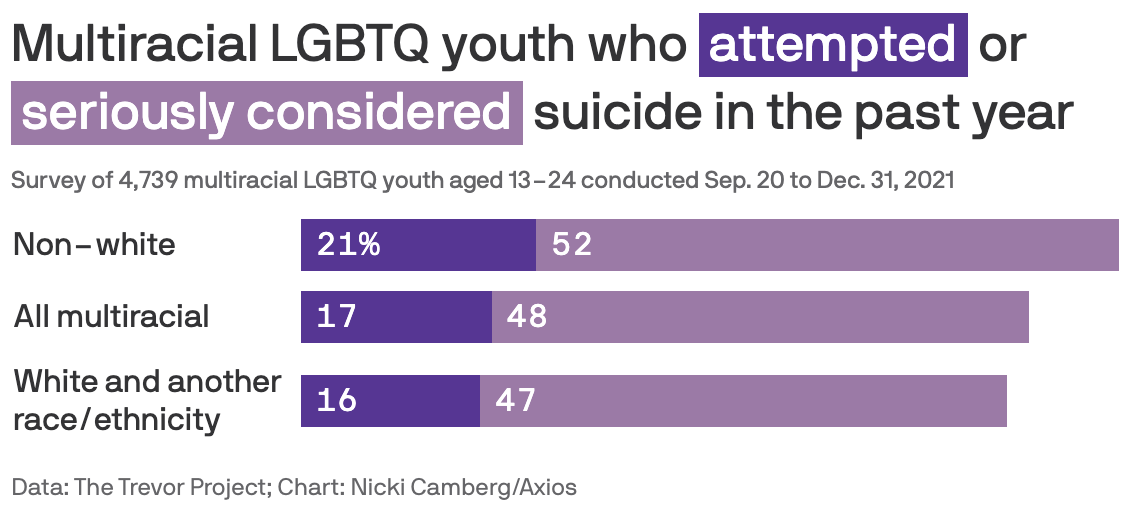
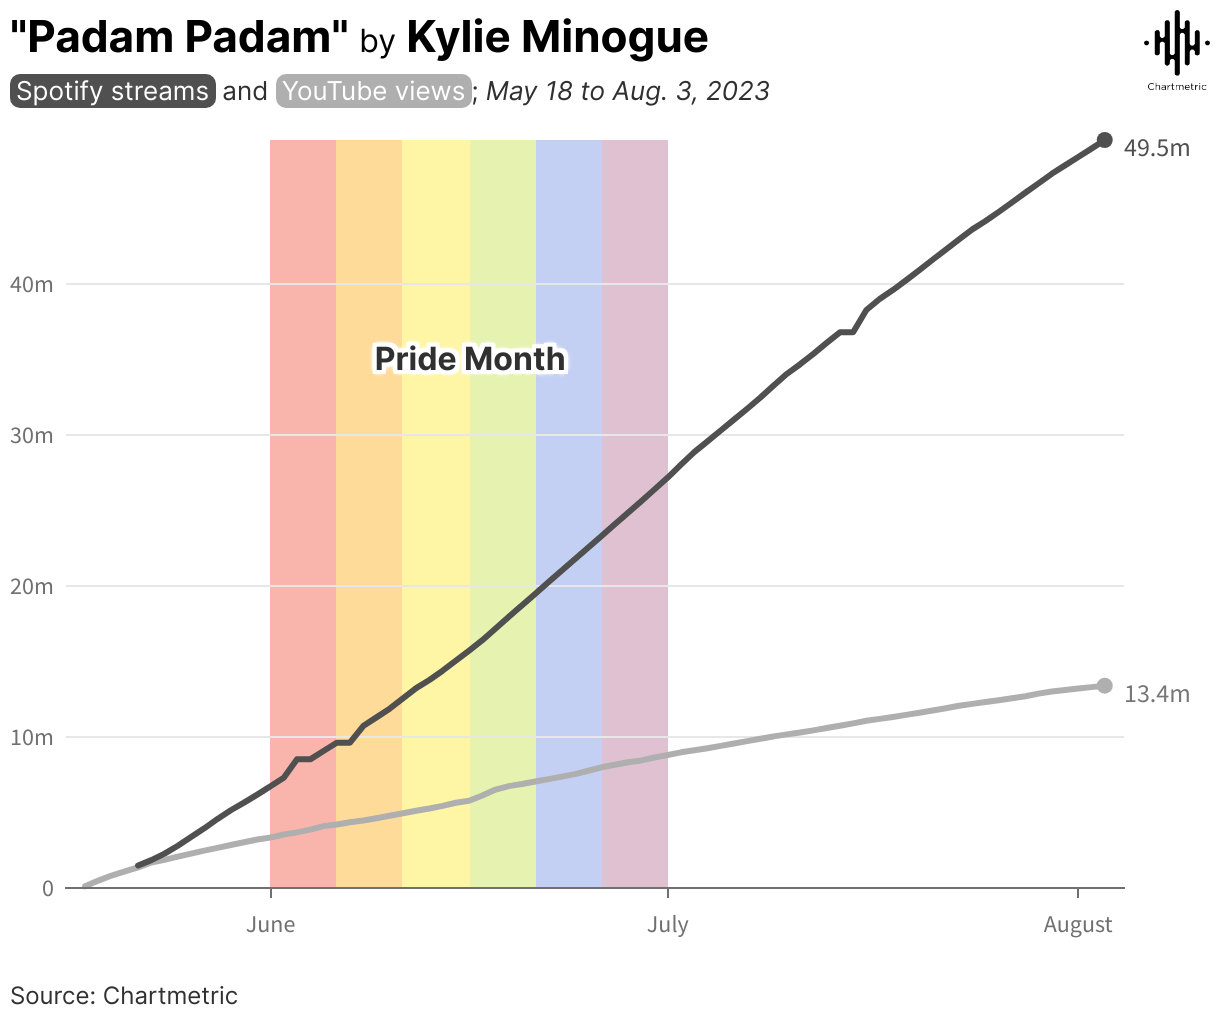
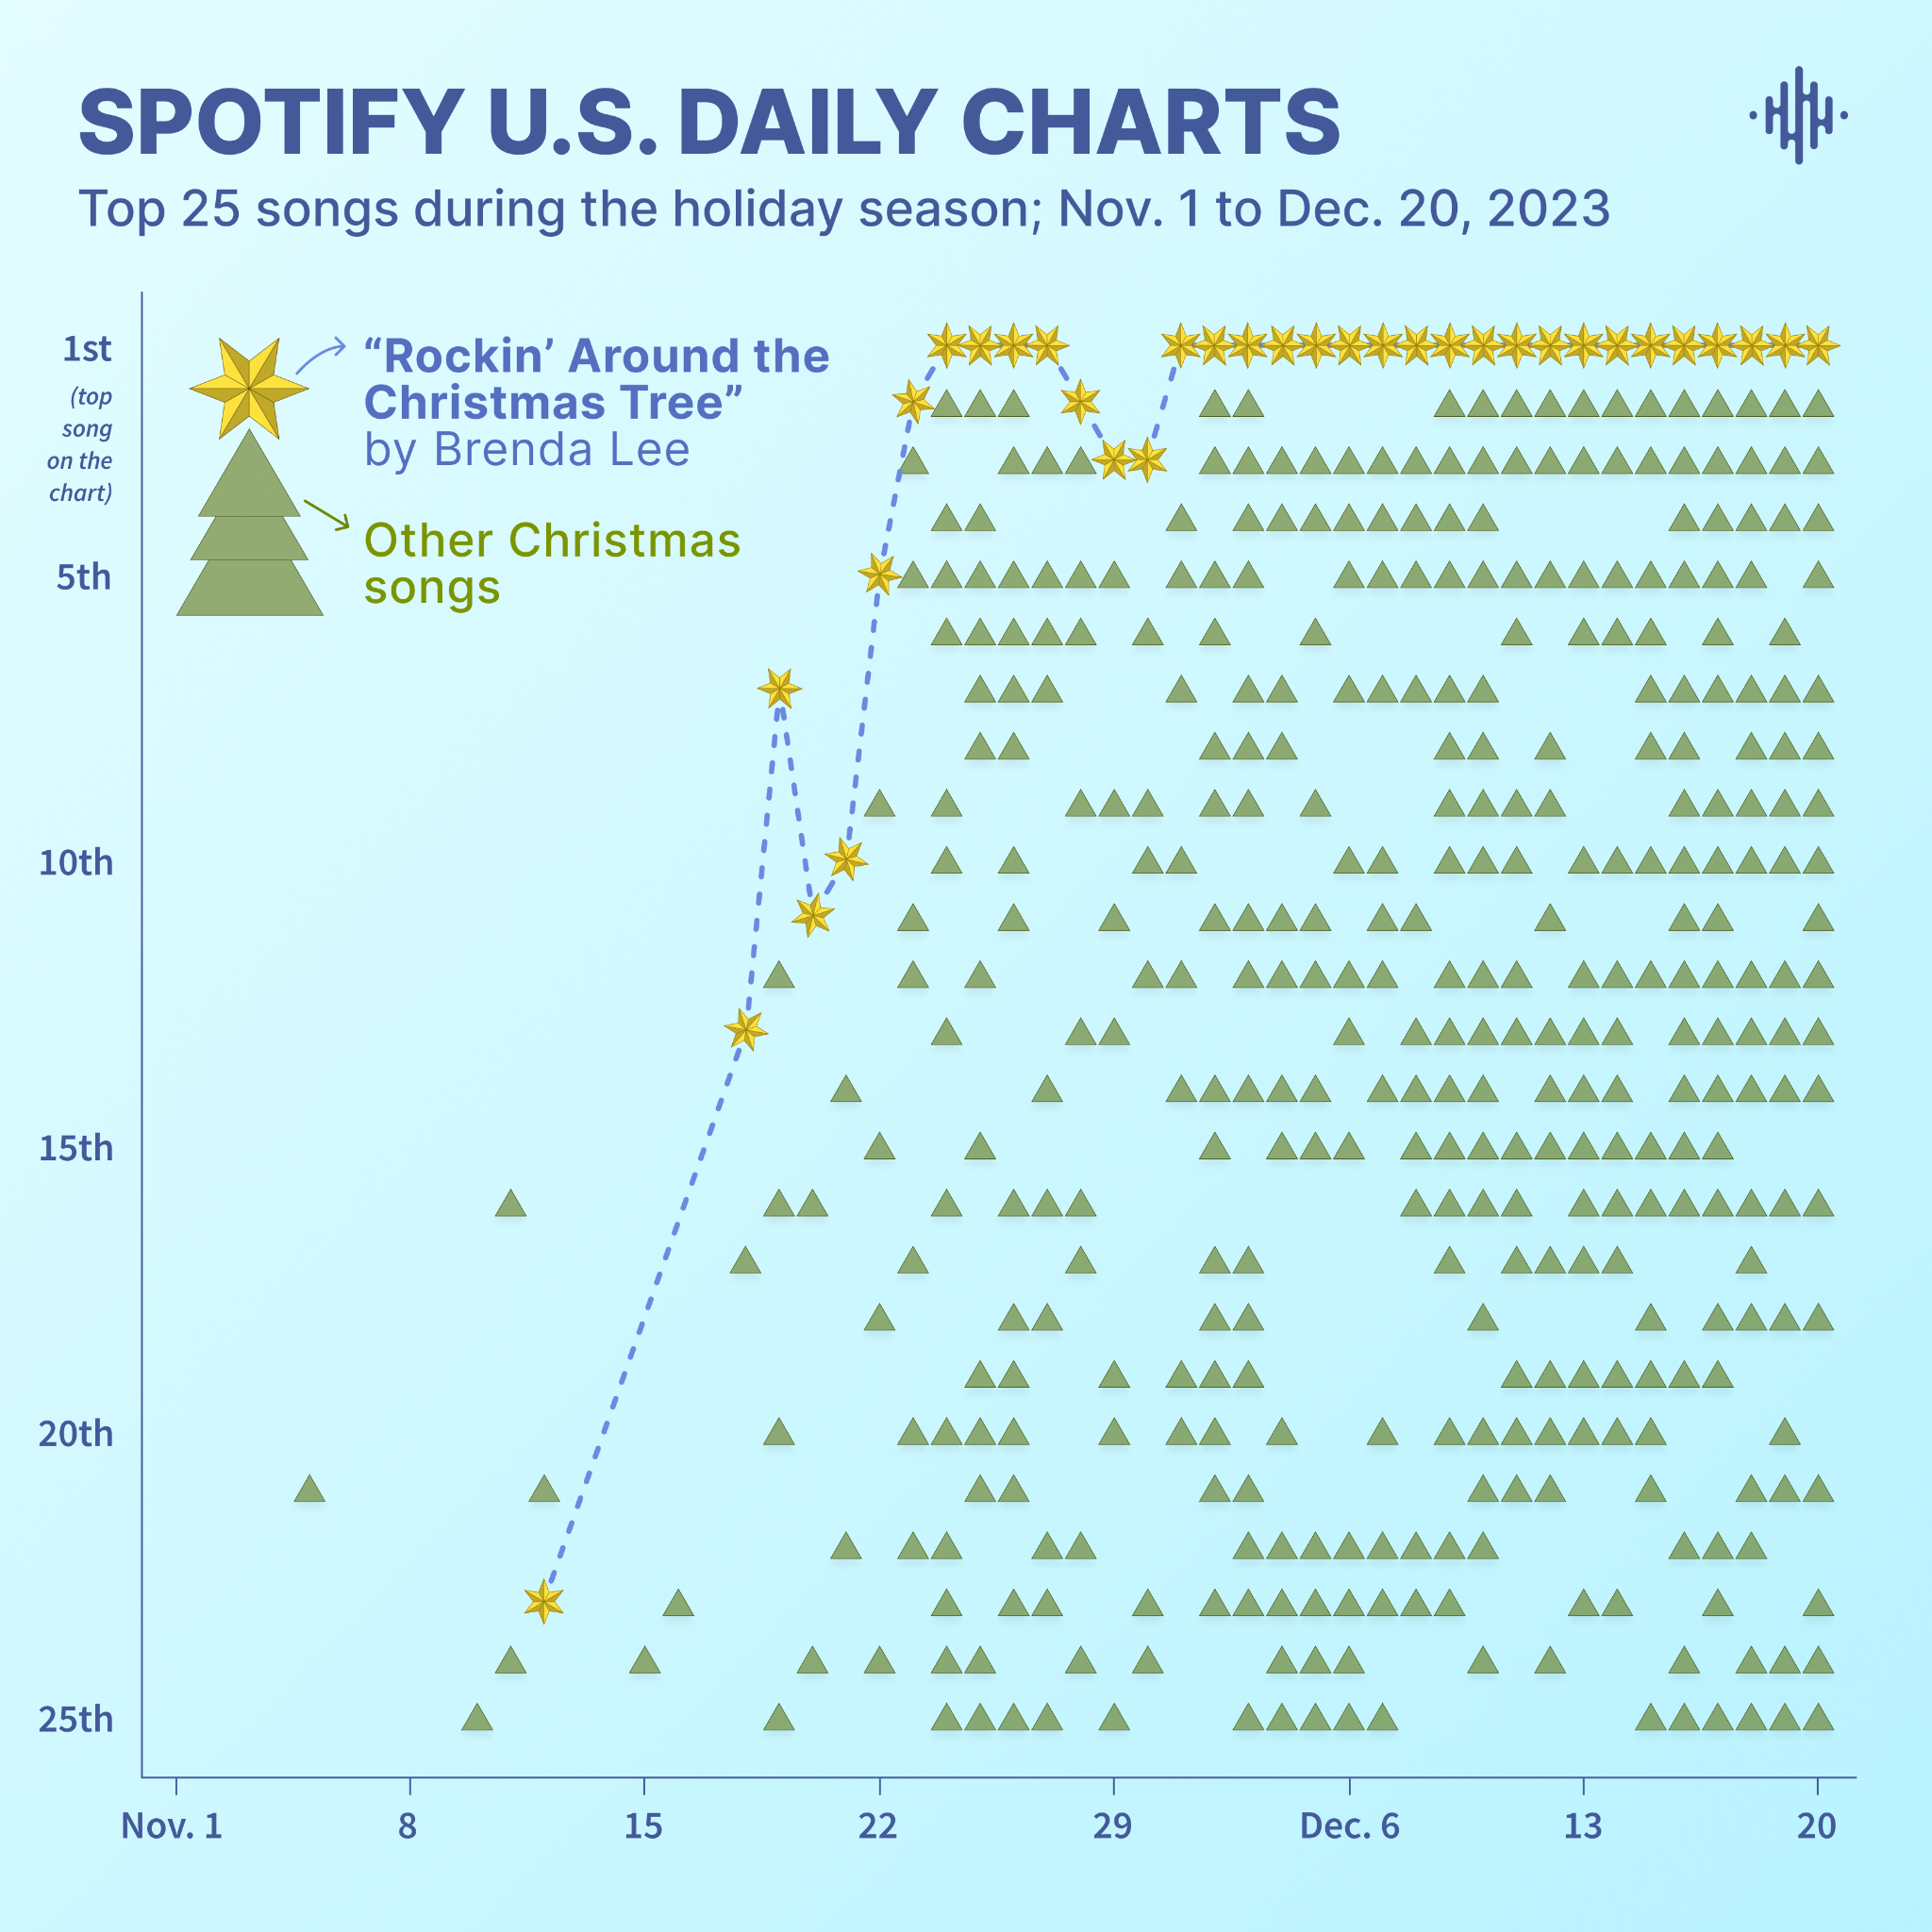
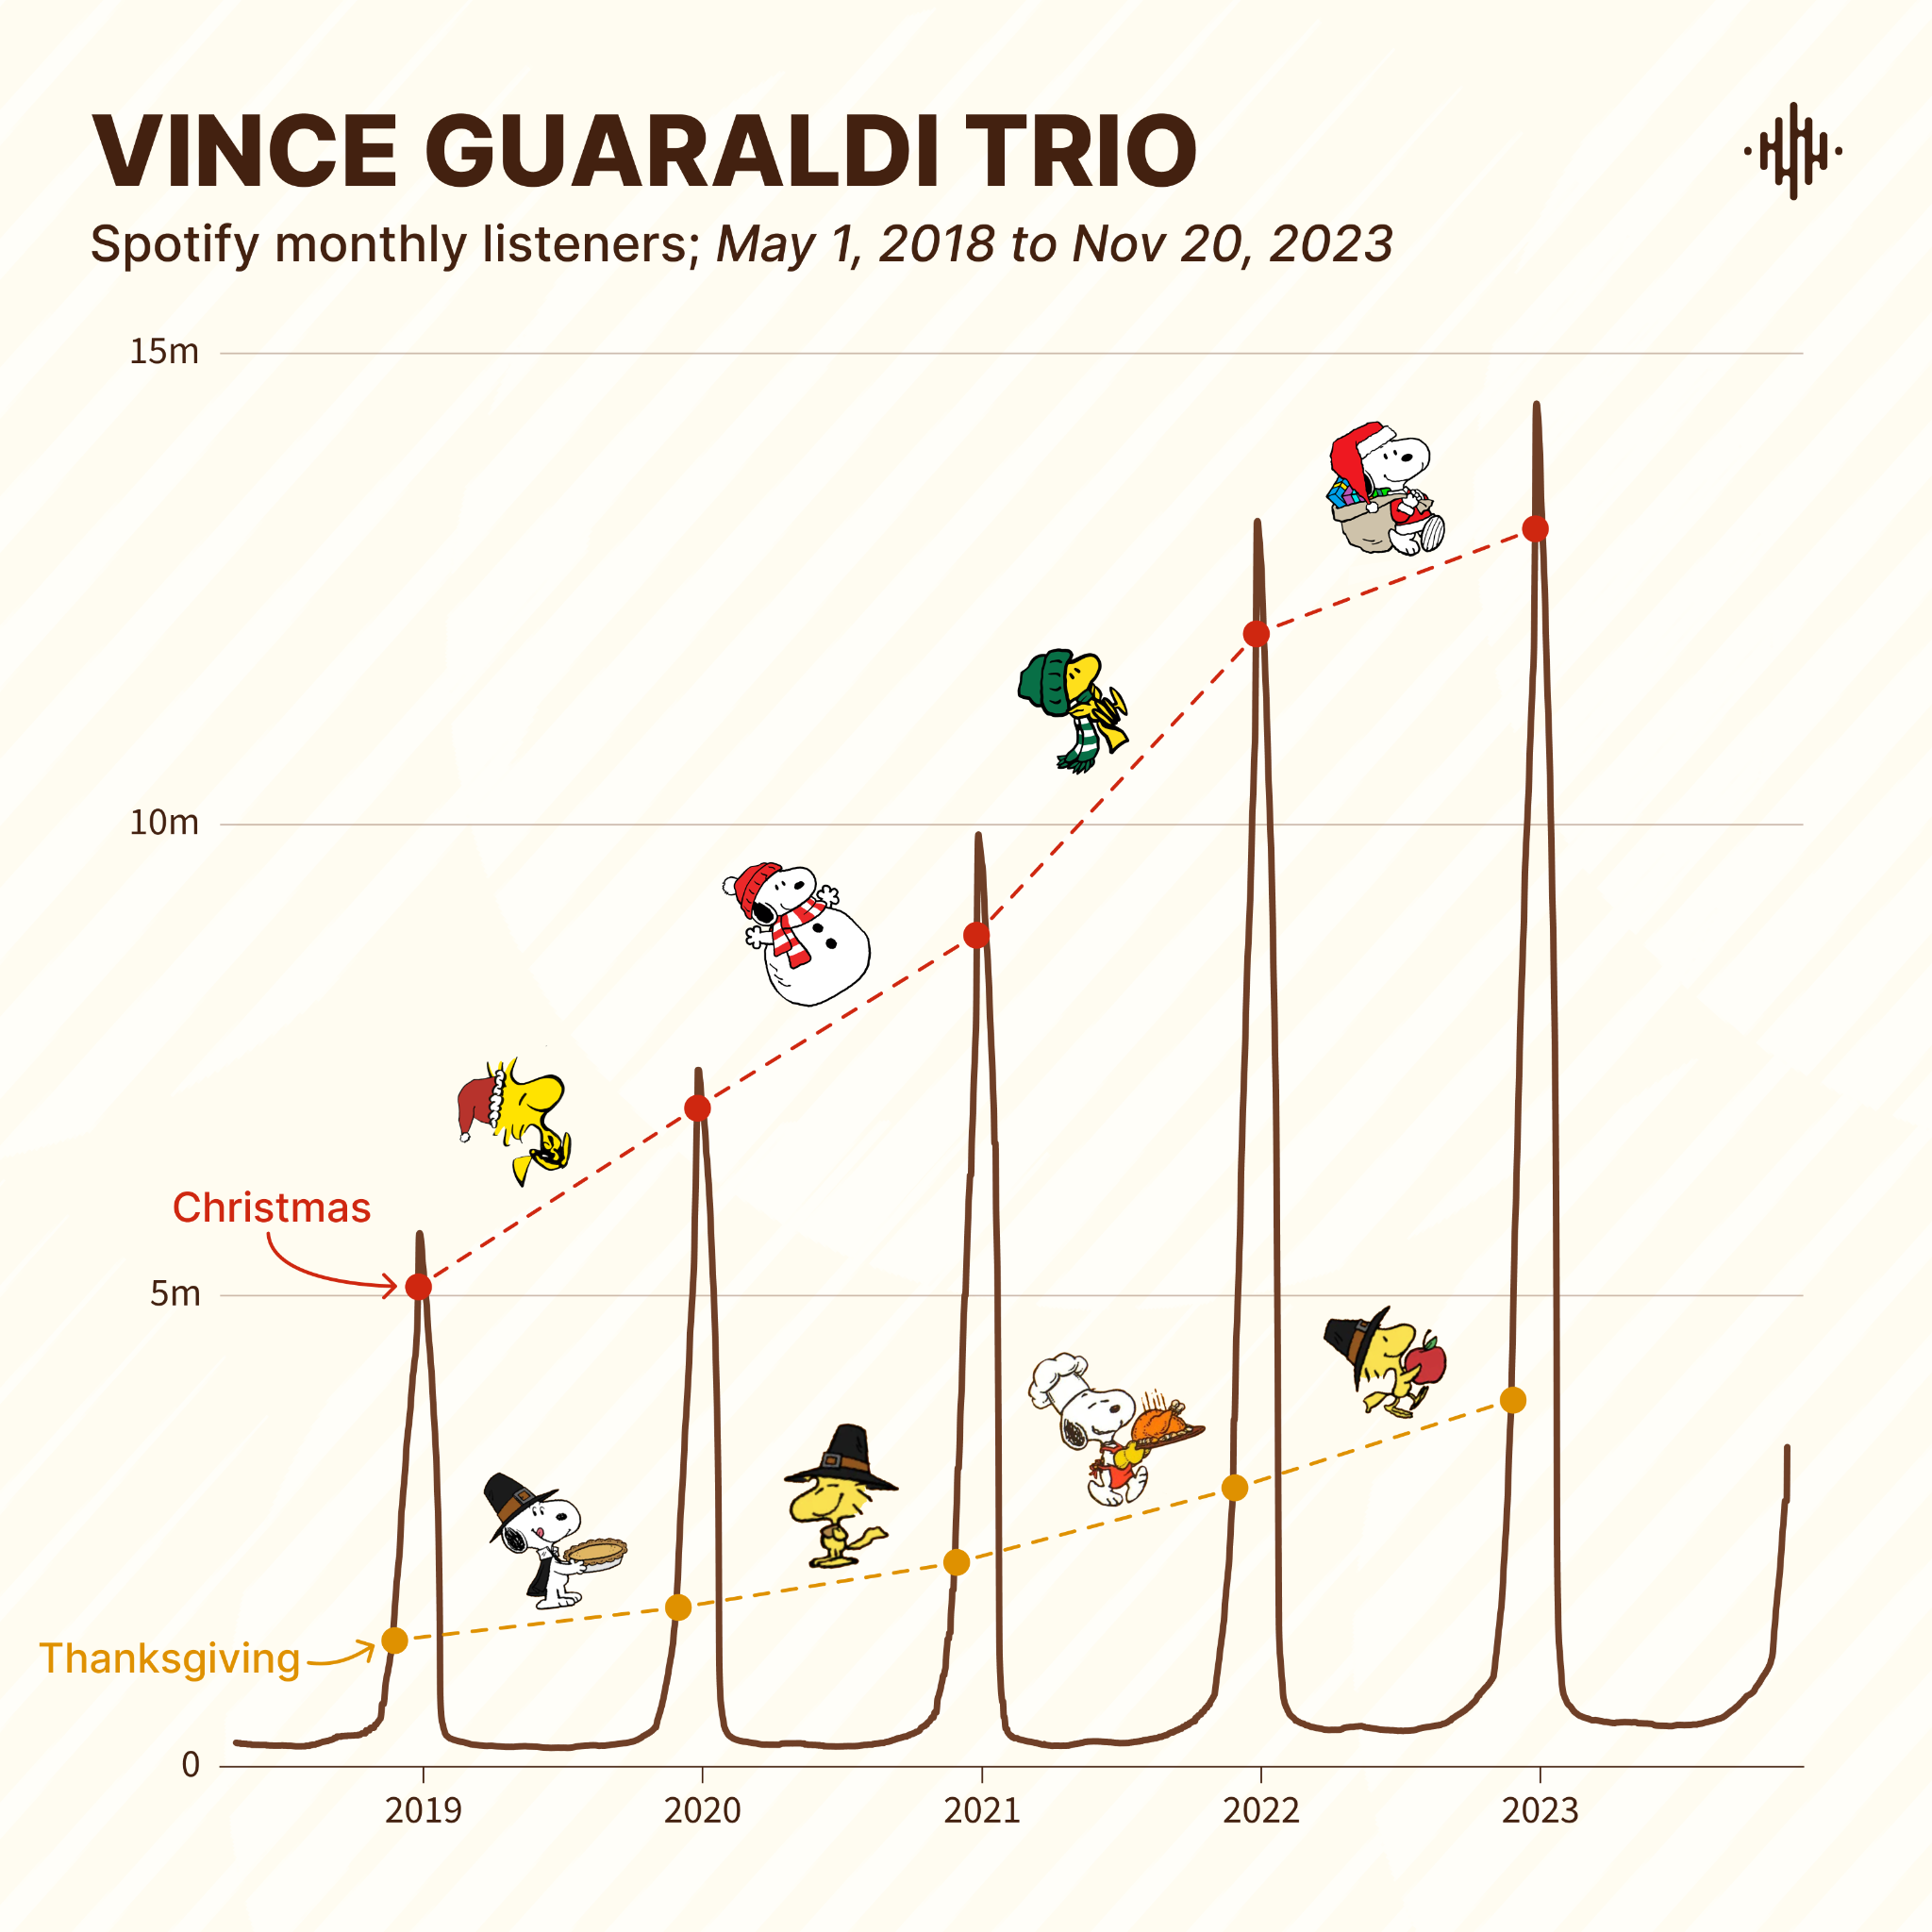
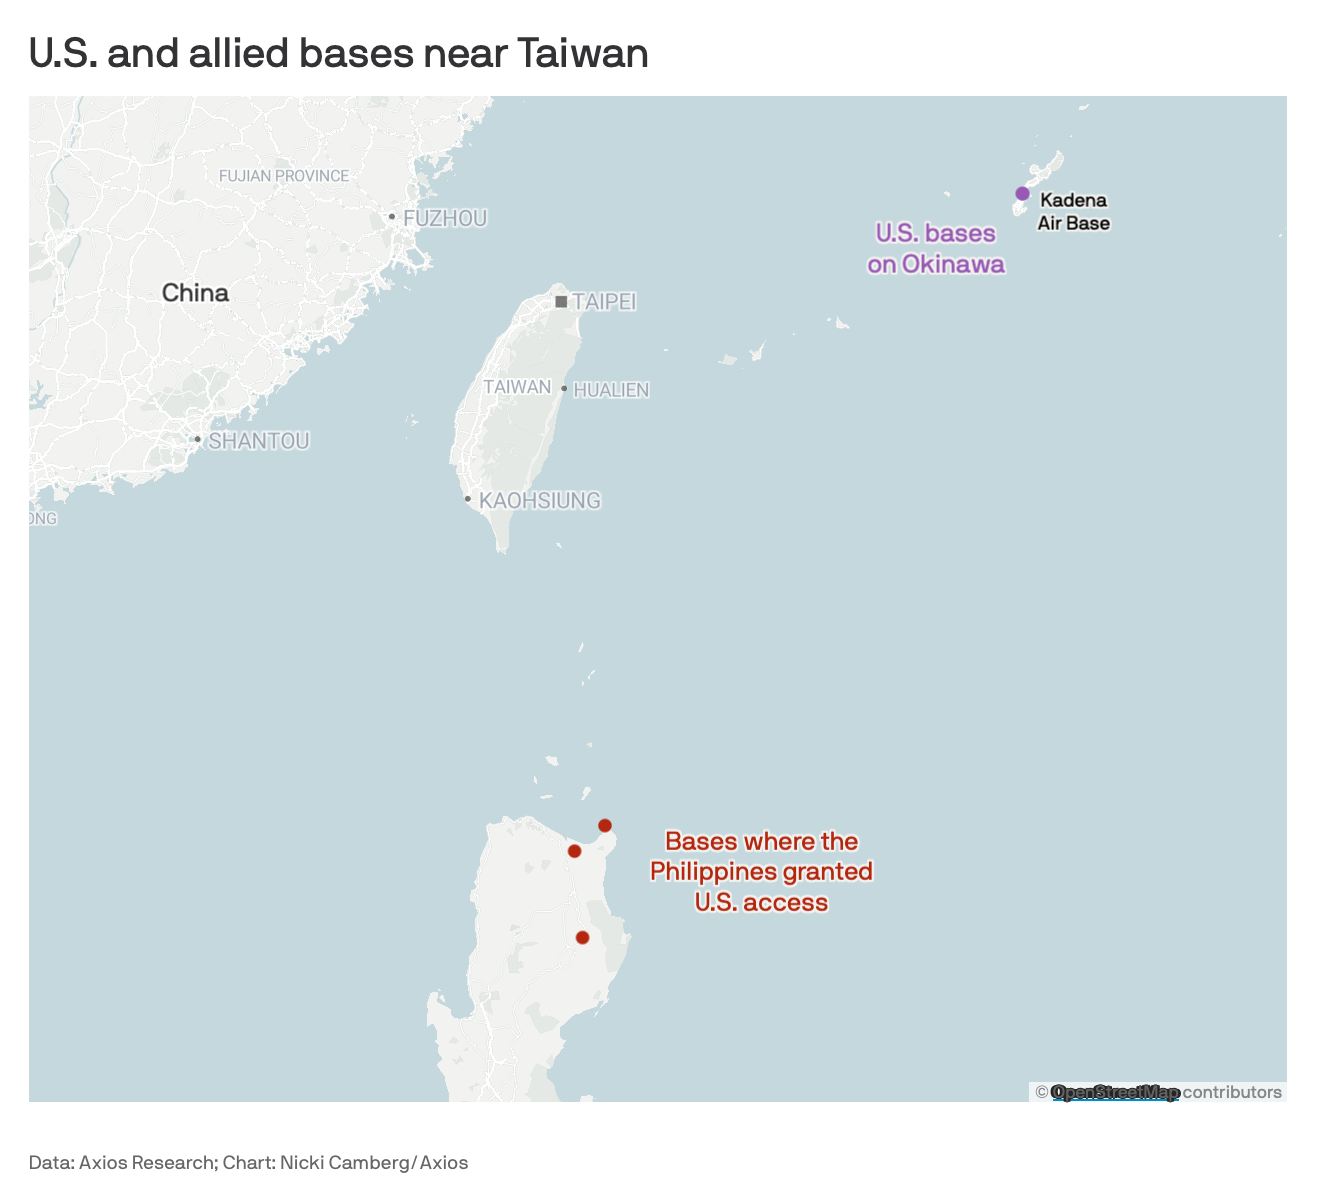
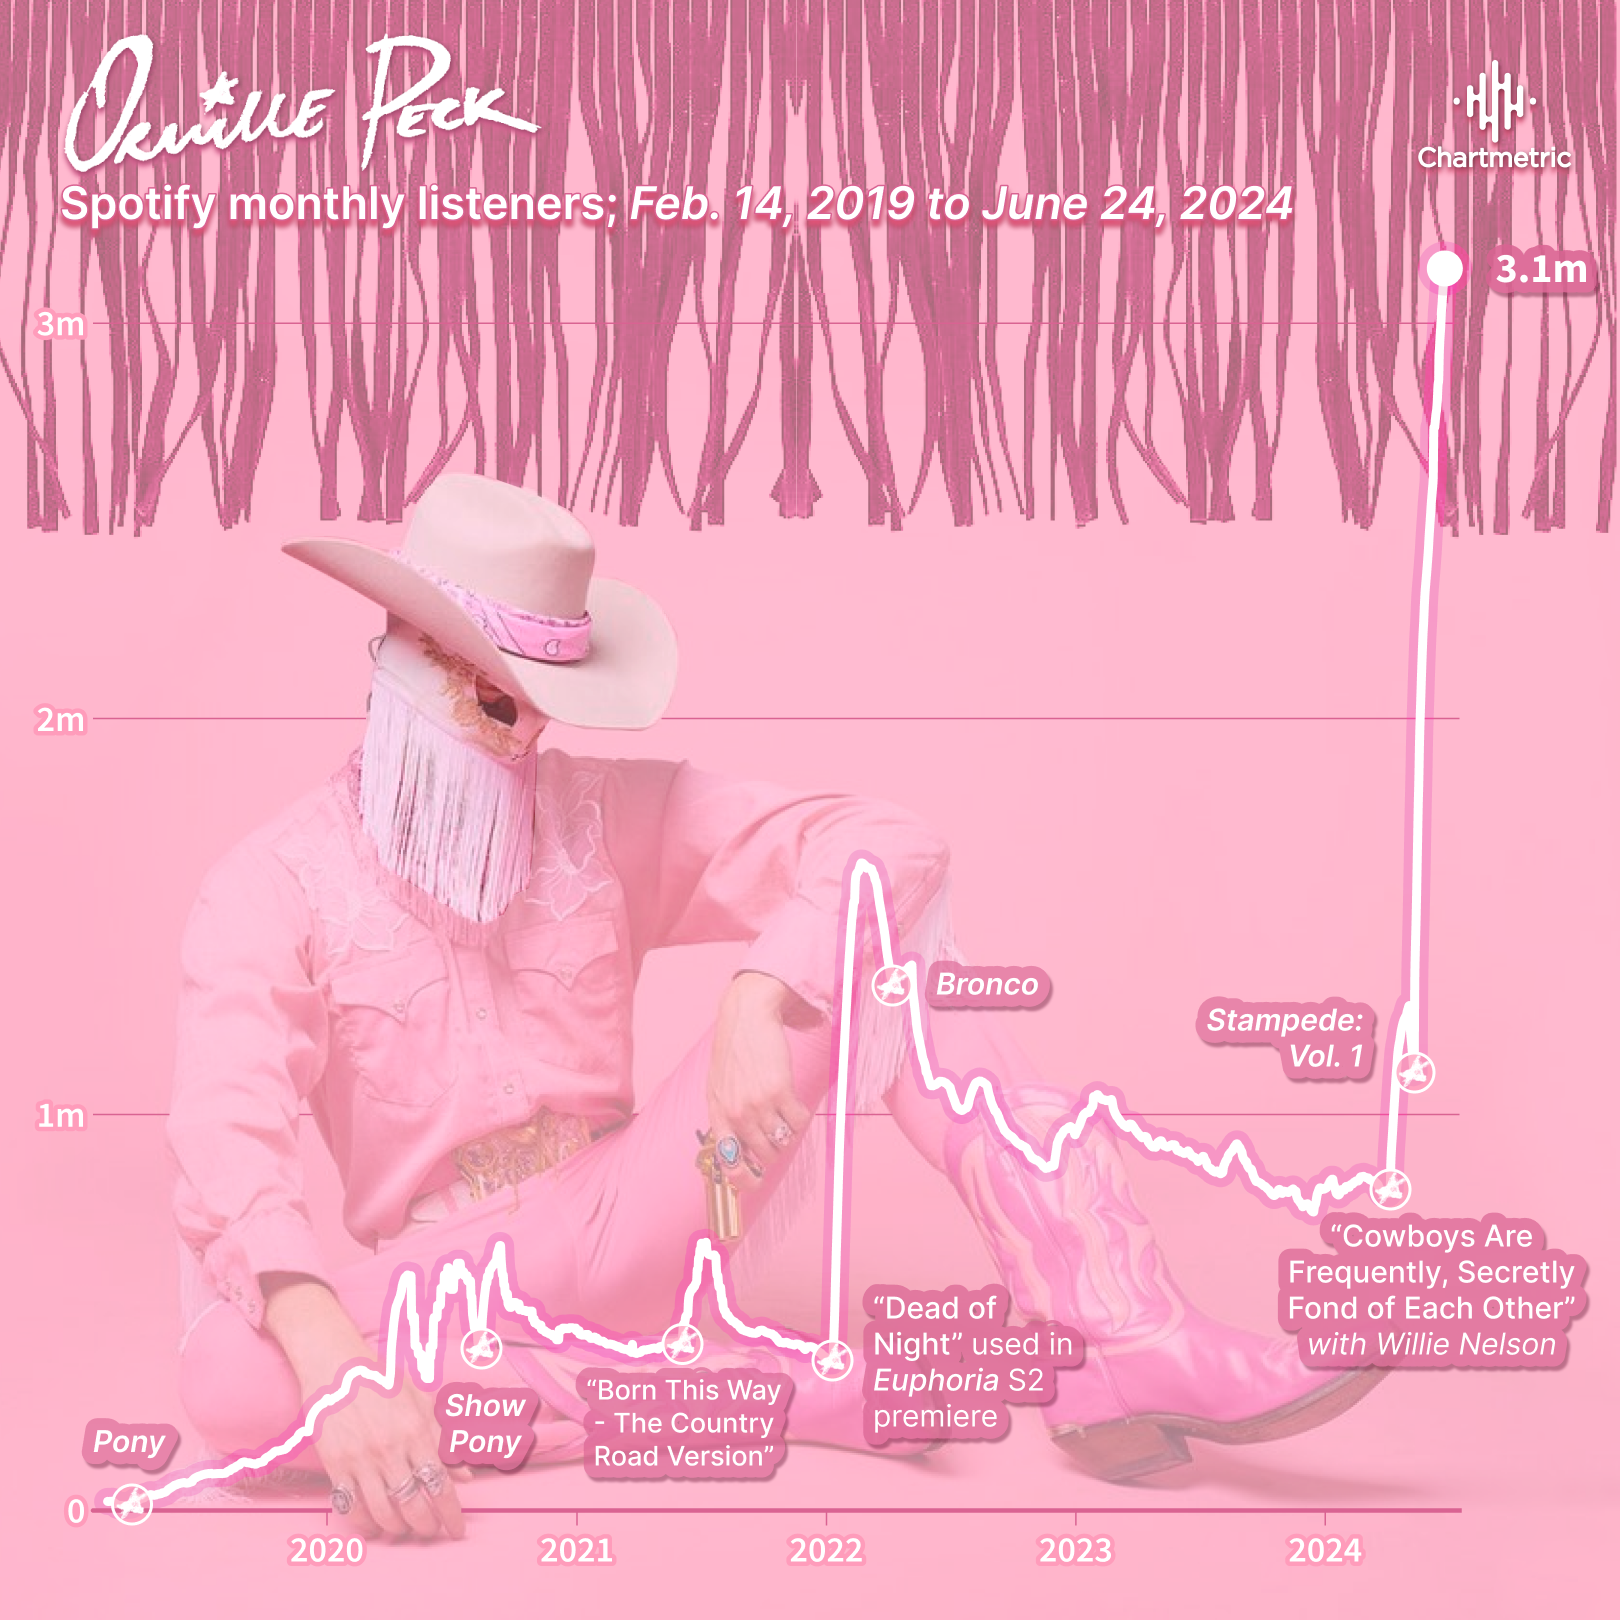
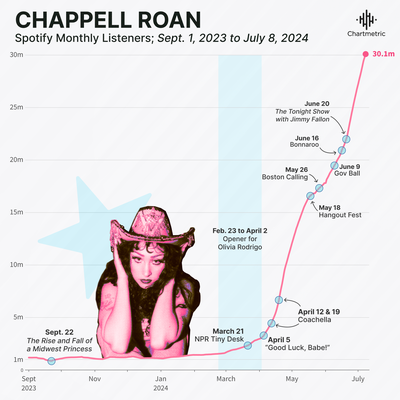
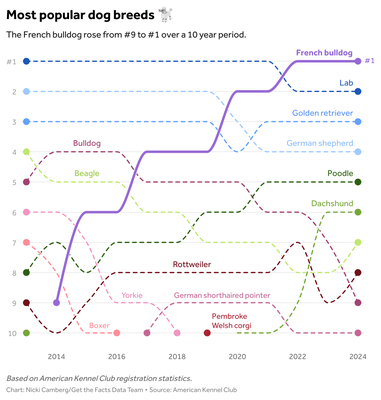
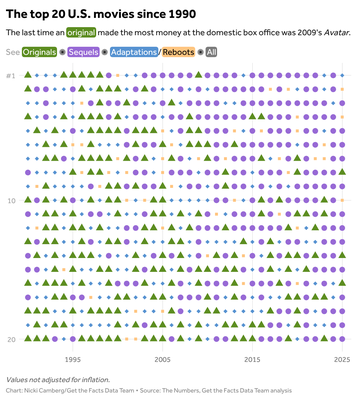
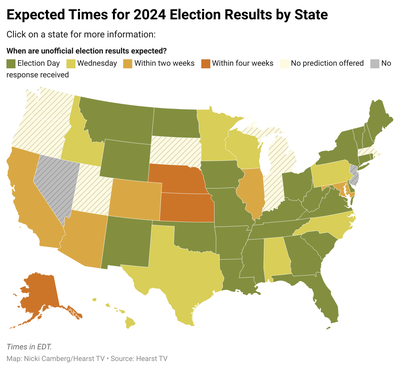
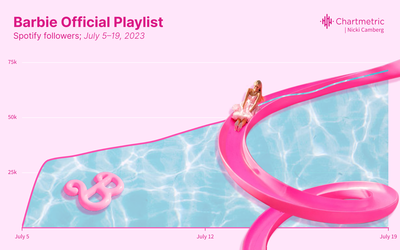
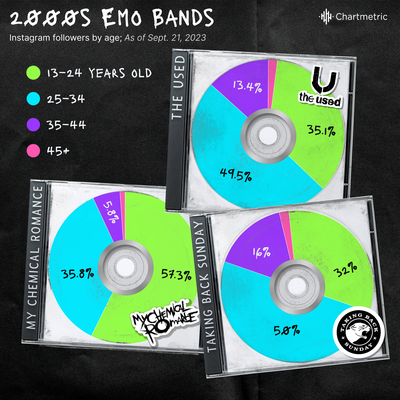
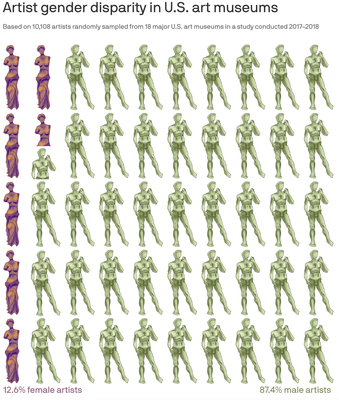
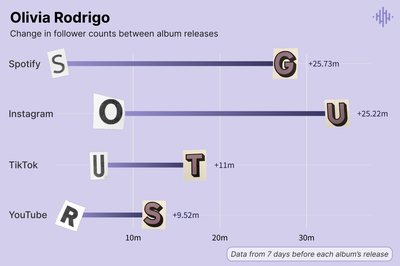
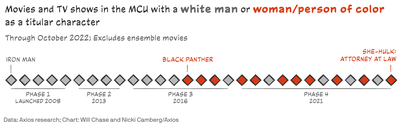
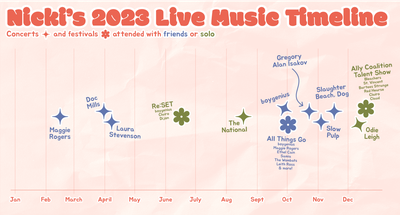
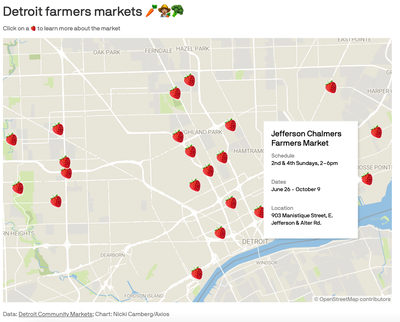
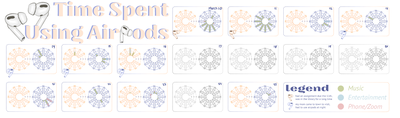
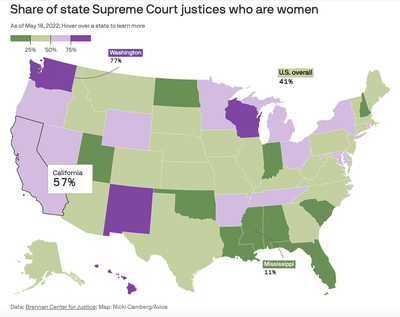
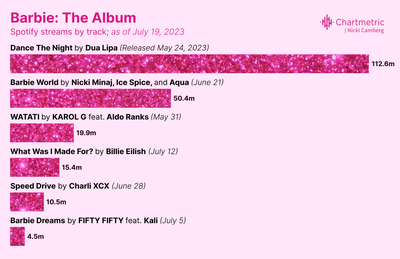
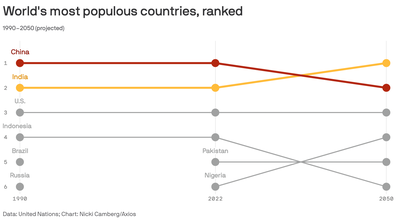
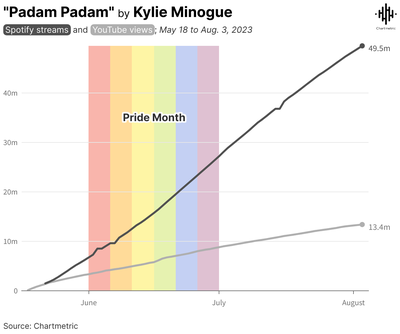
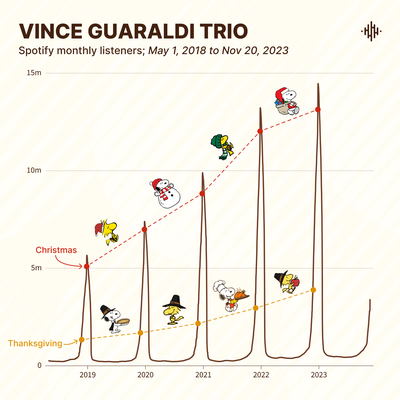
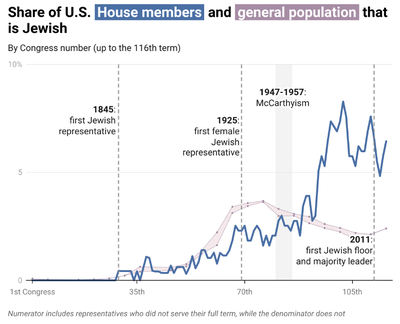
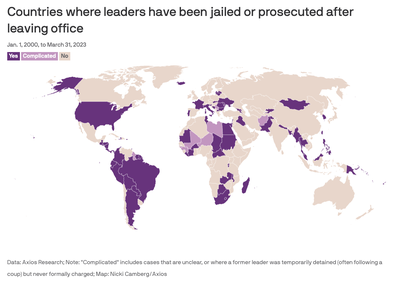
SubscribeThese are some of my favorite data visualizations I've made using Datawrapper, R, Adobe Illustrator, and Figma. Click on the charts to view them in full and see more information!
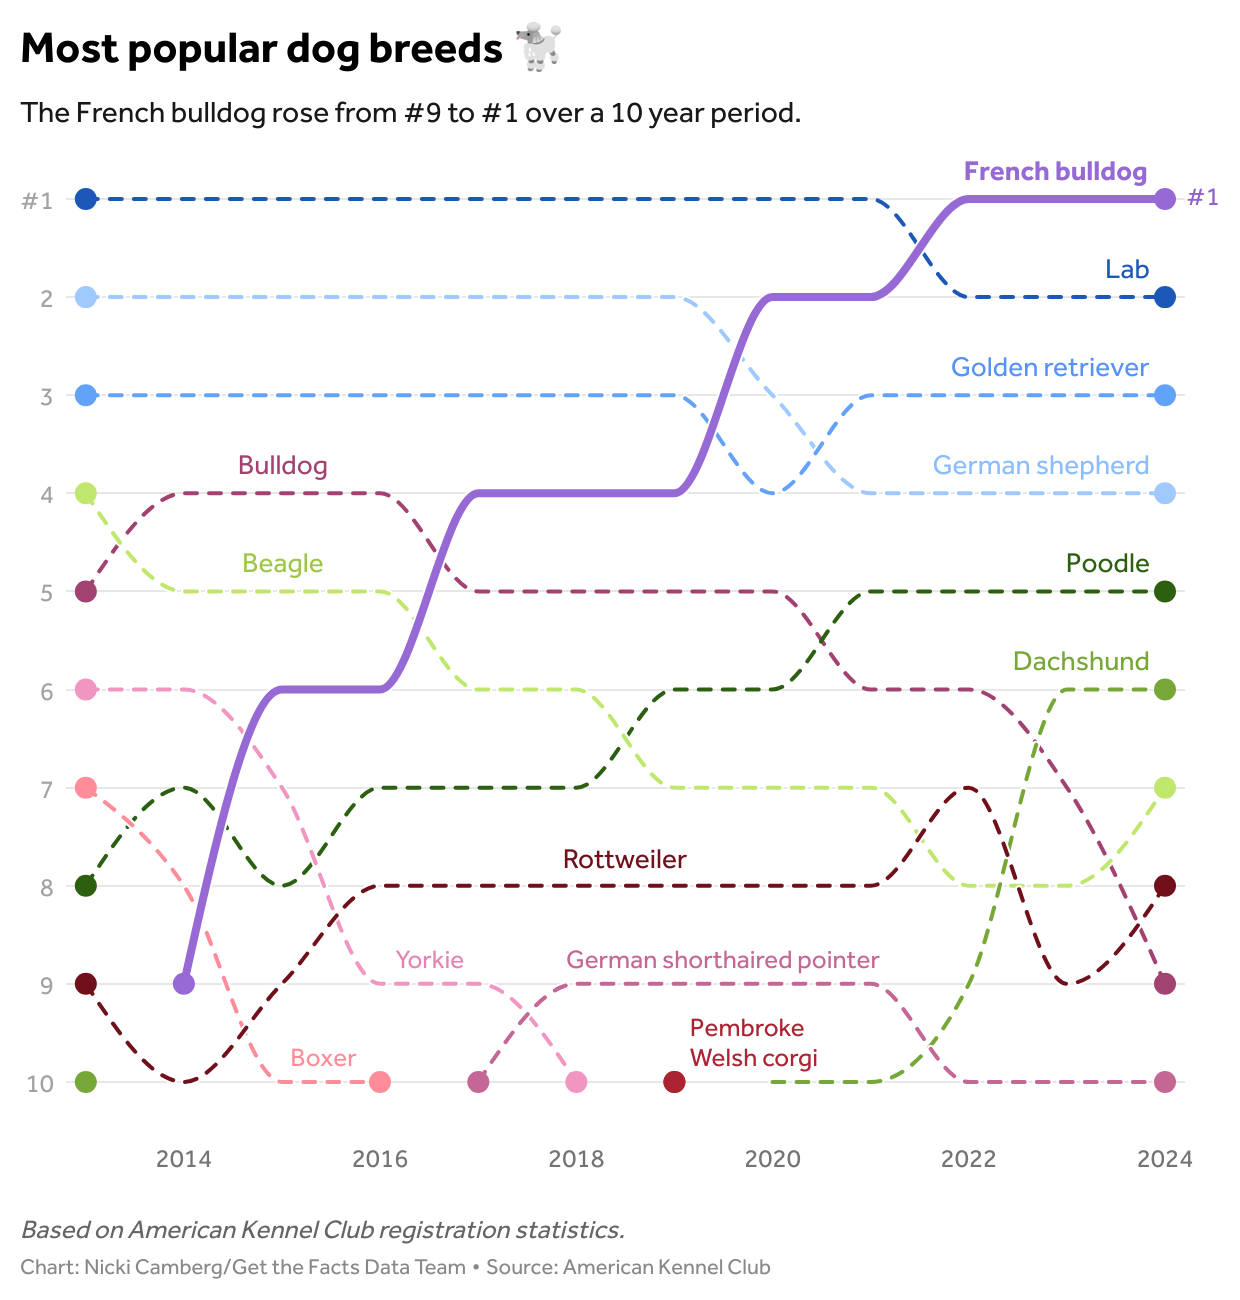
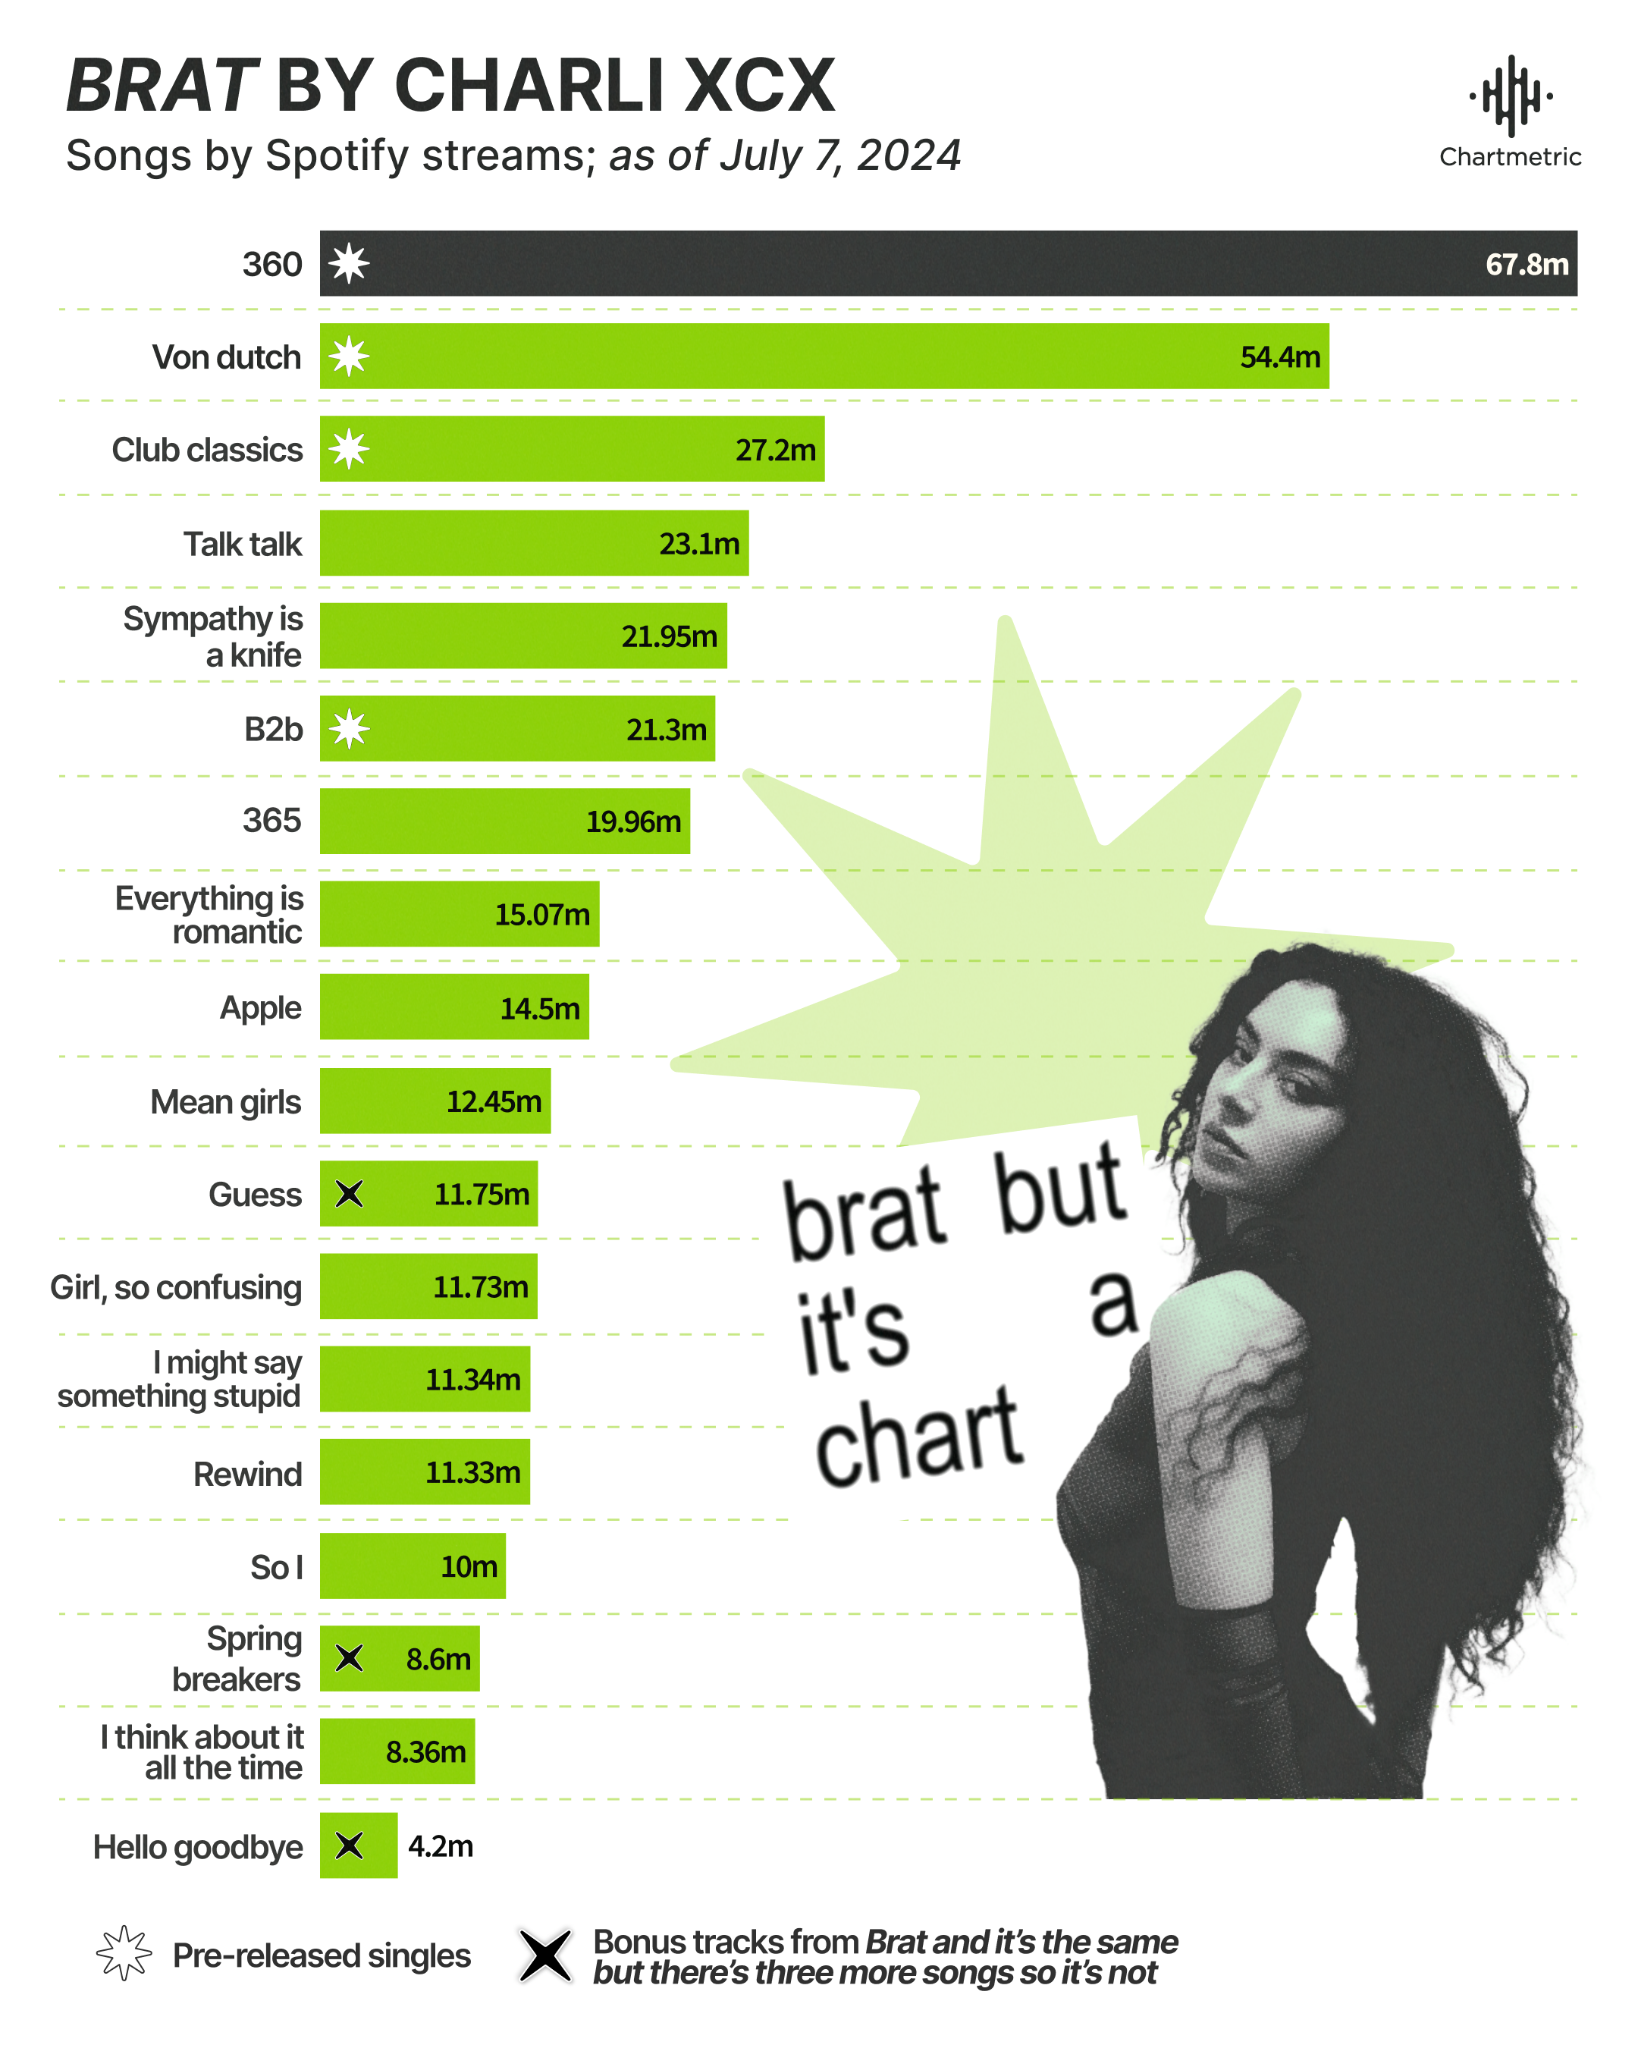
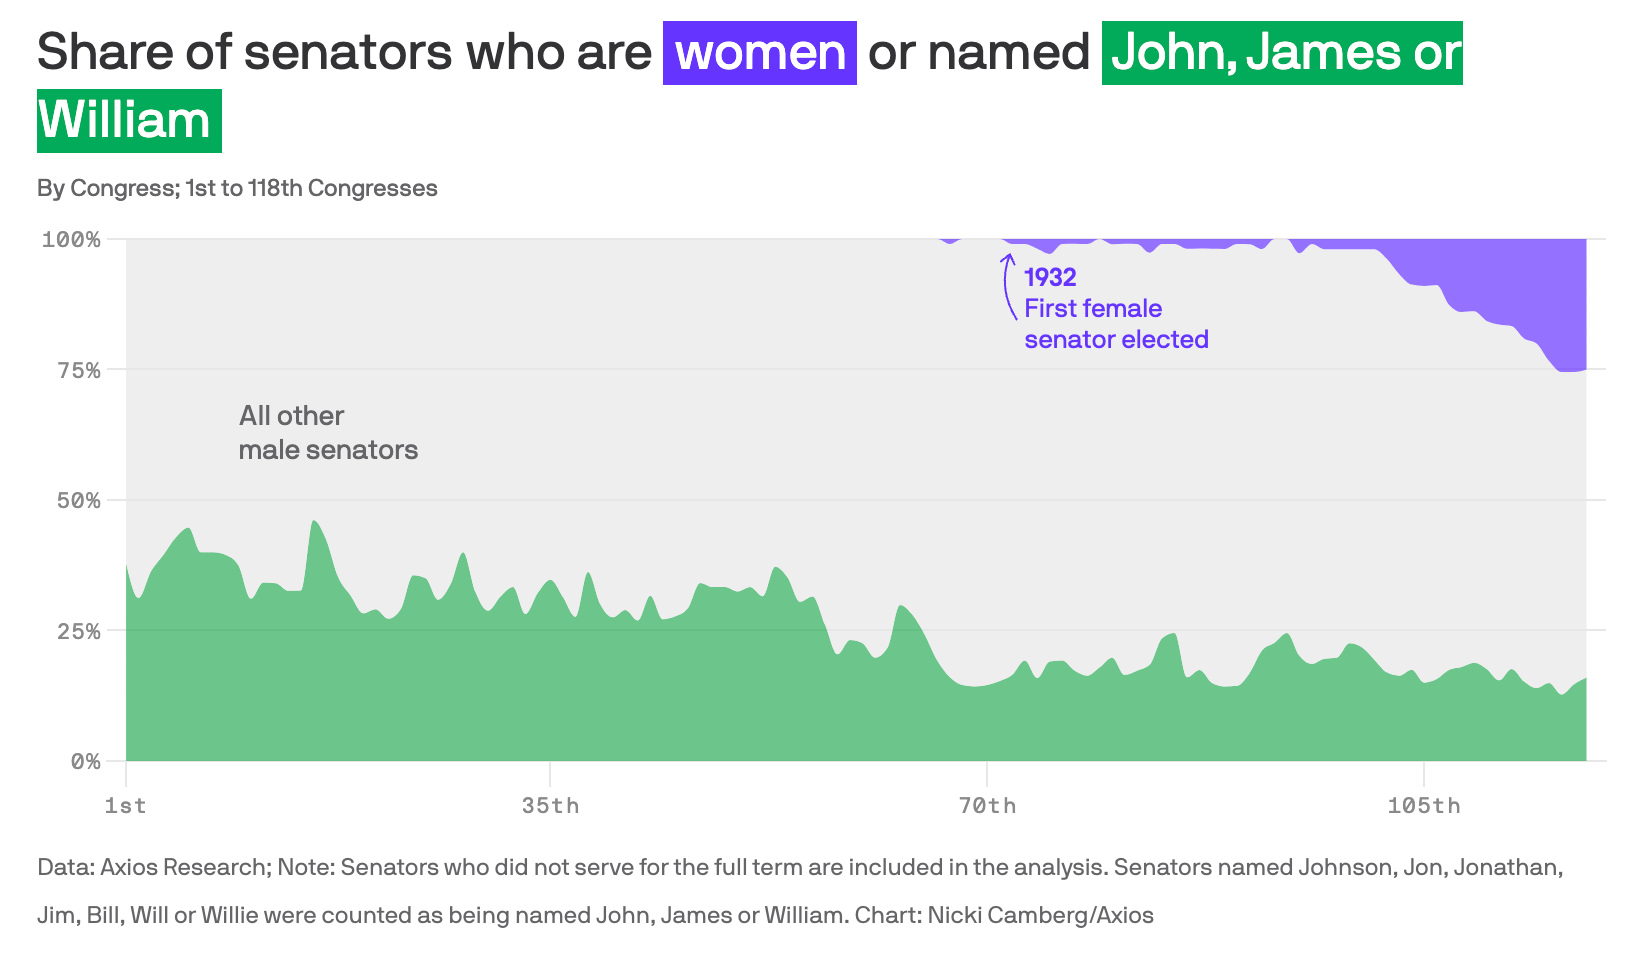
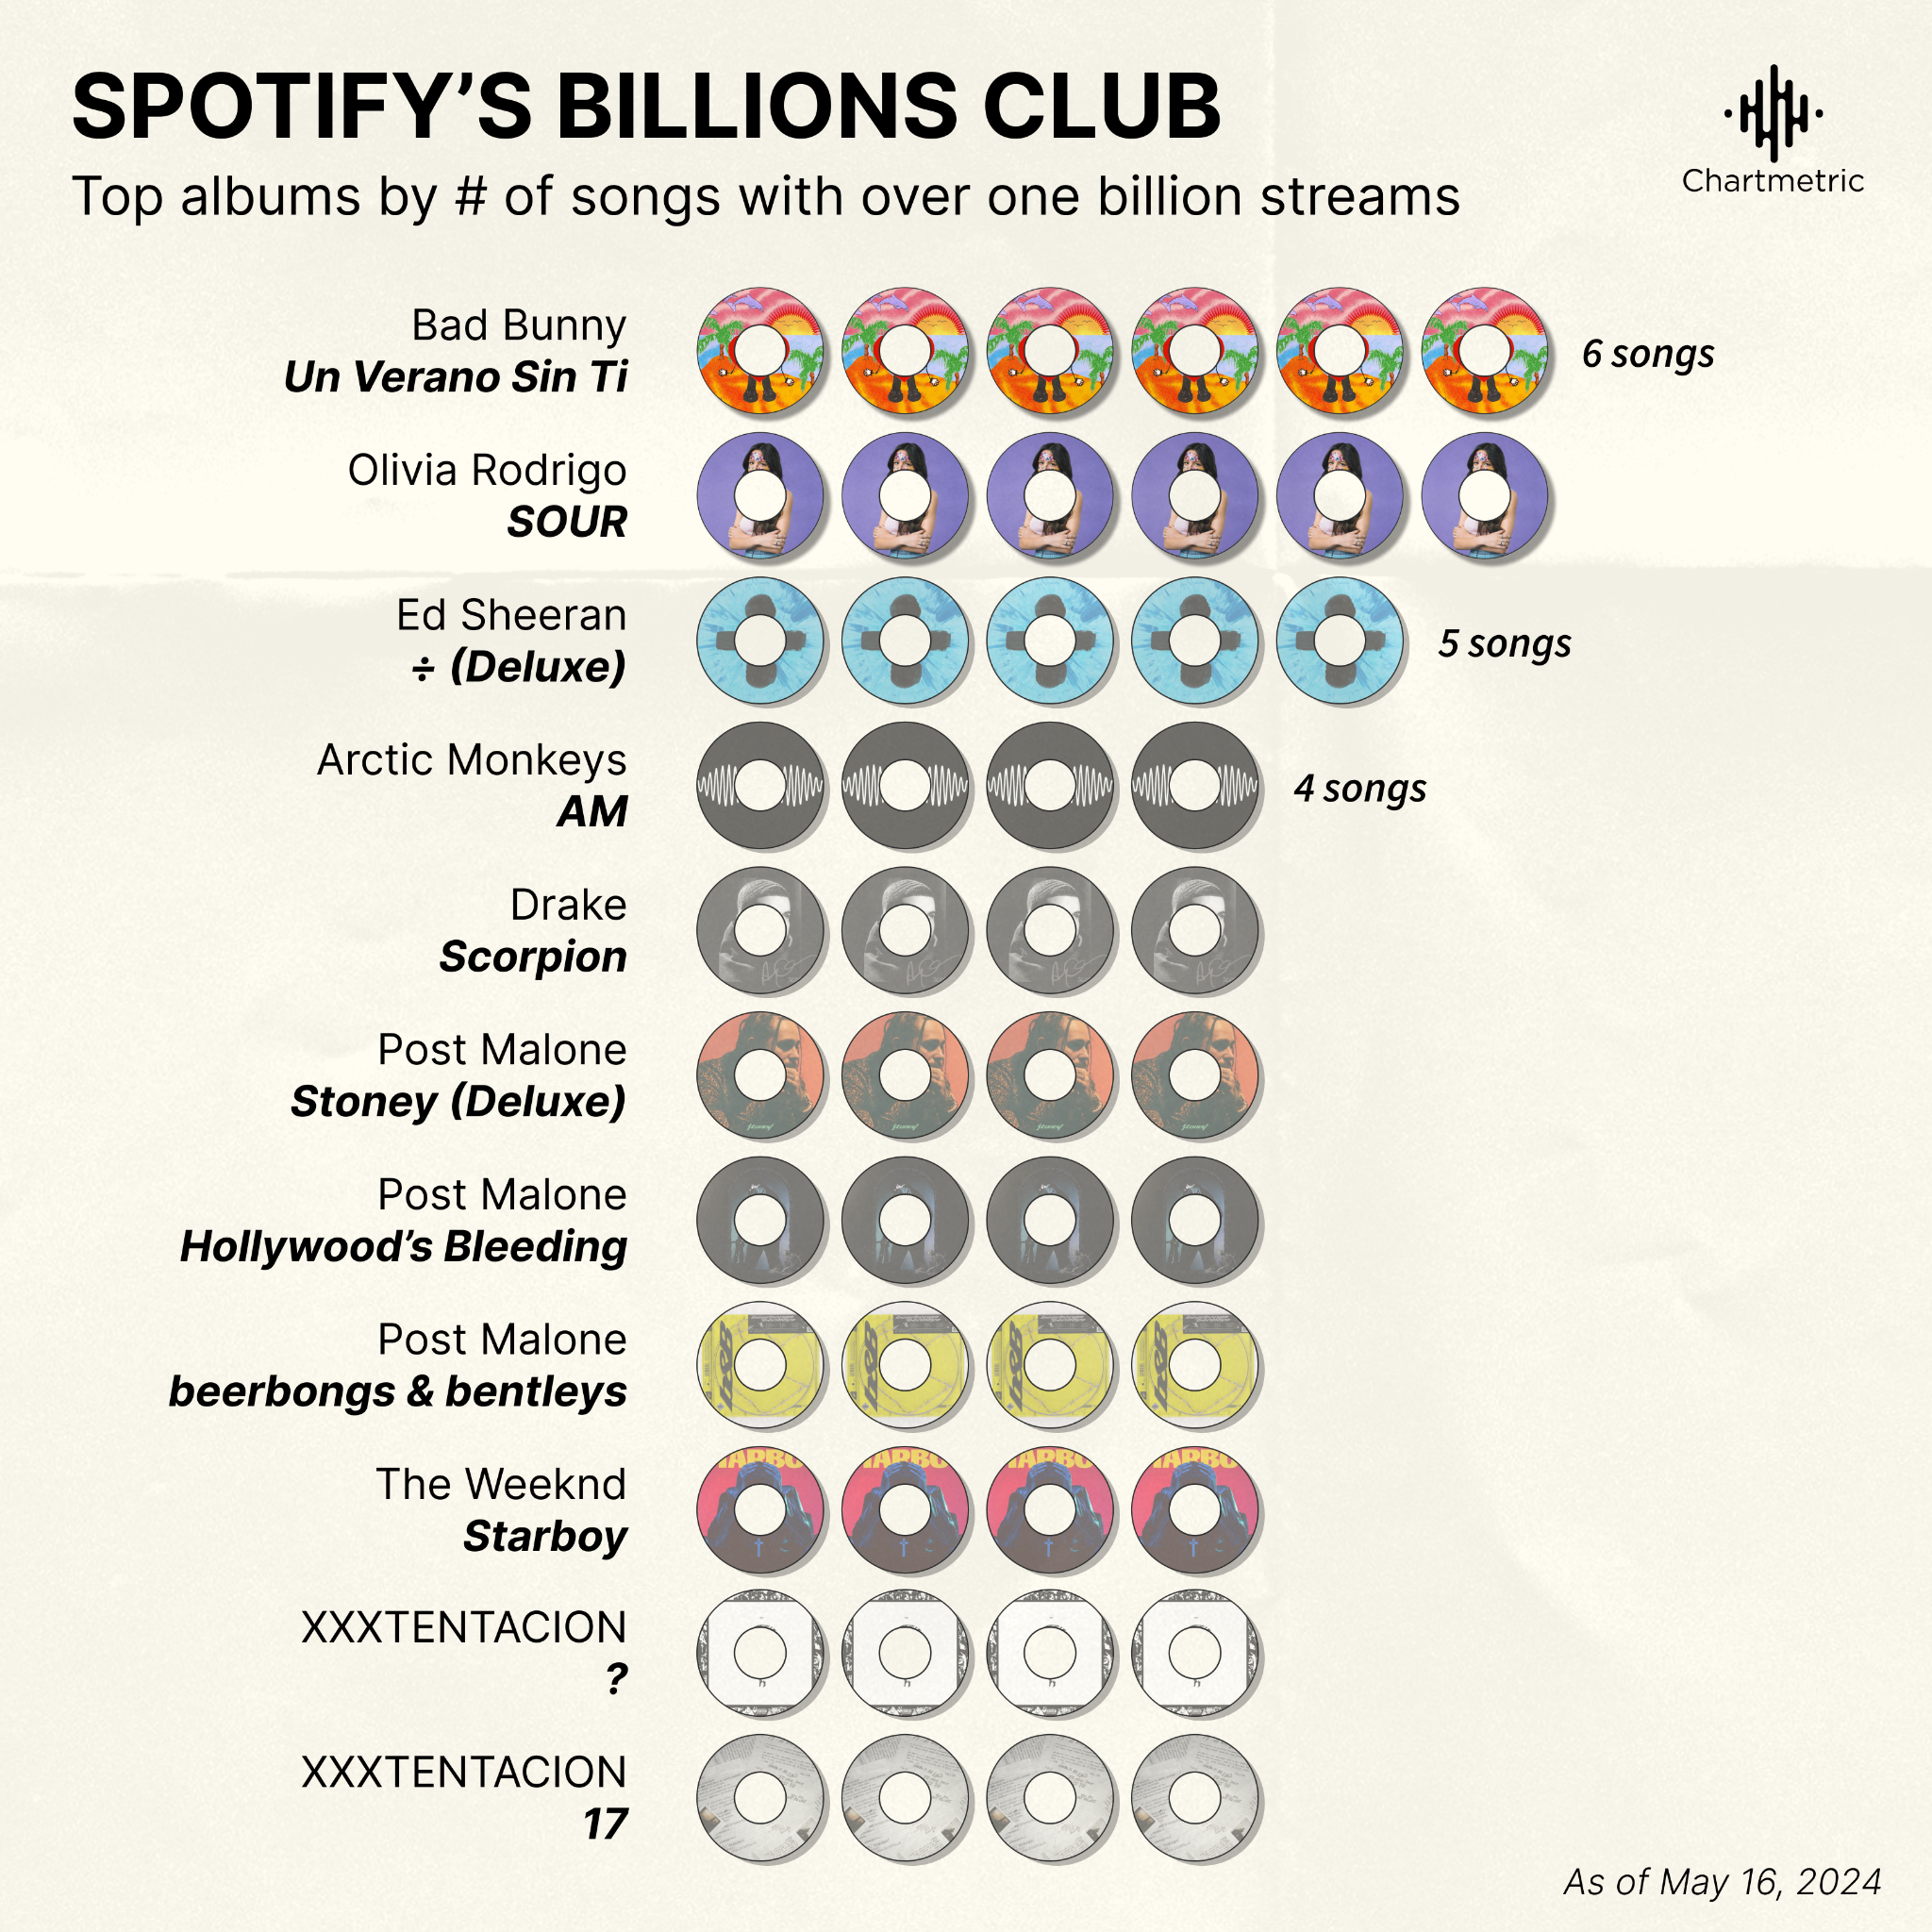
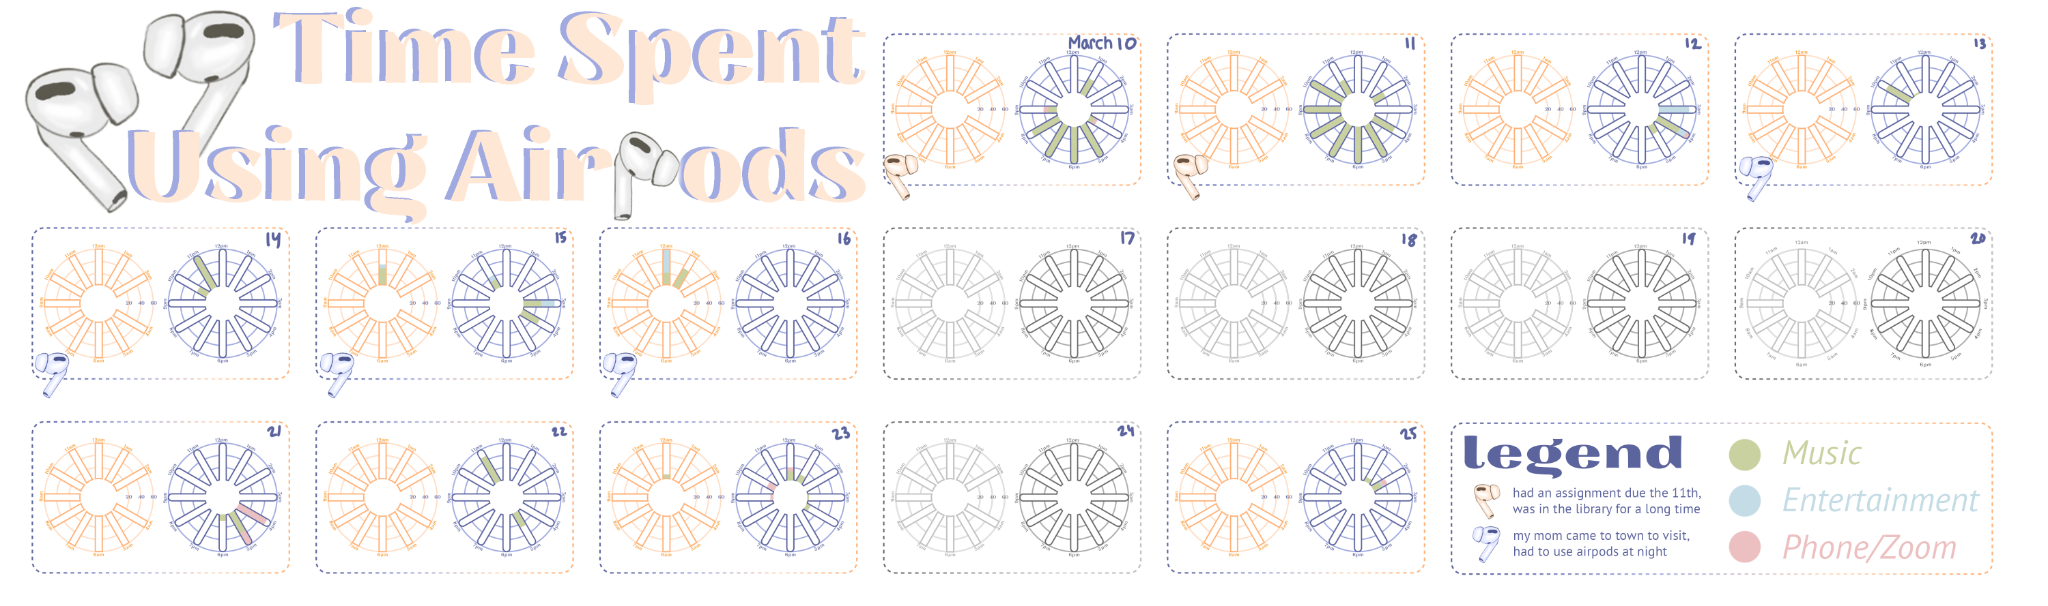
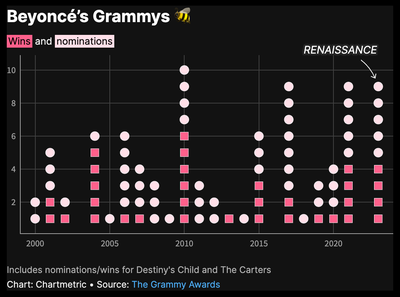
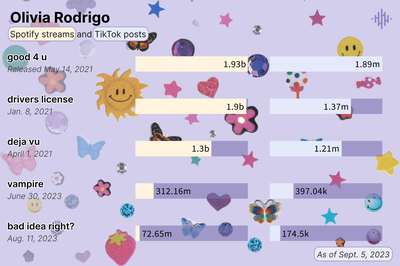
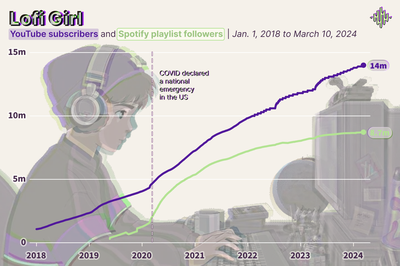
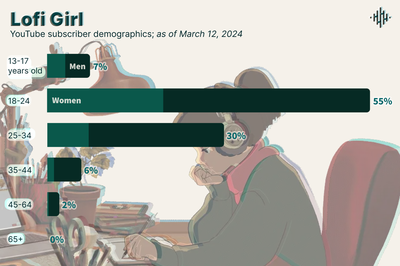
I'm a firm believer that charts can be fun! Over the years, this has developed into a bit of a signature style that once was described to me by a coworker as "chart maximalism," which you may see throughout my work :)


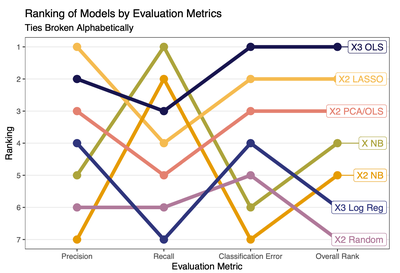
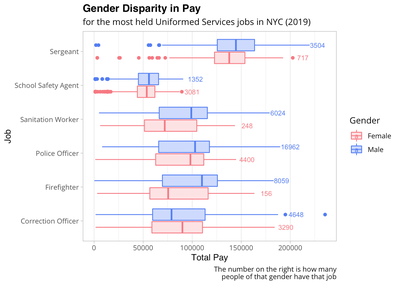
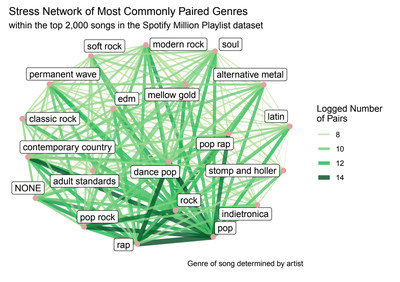
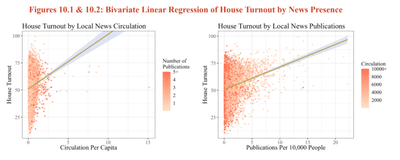
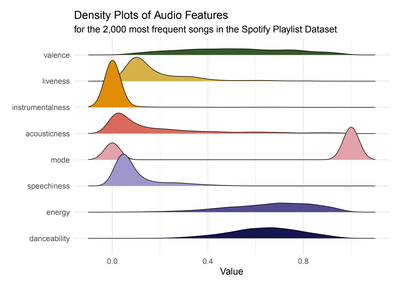
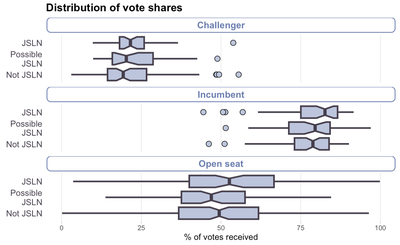
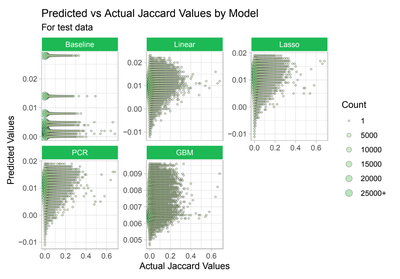
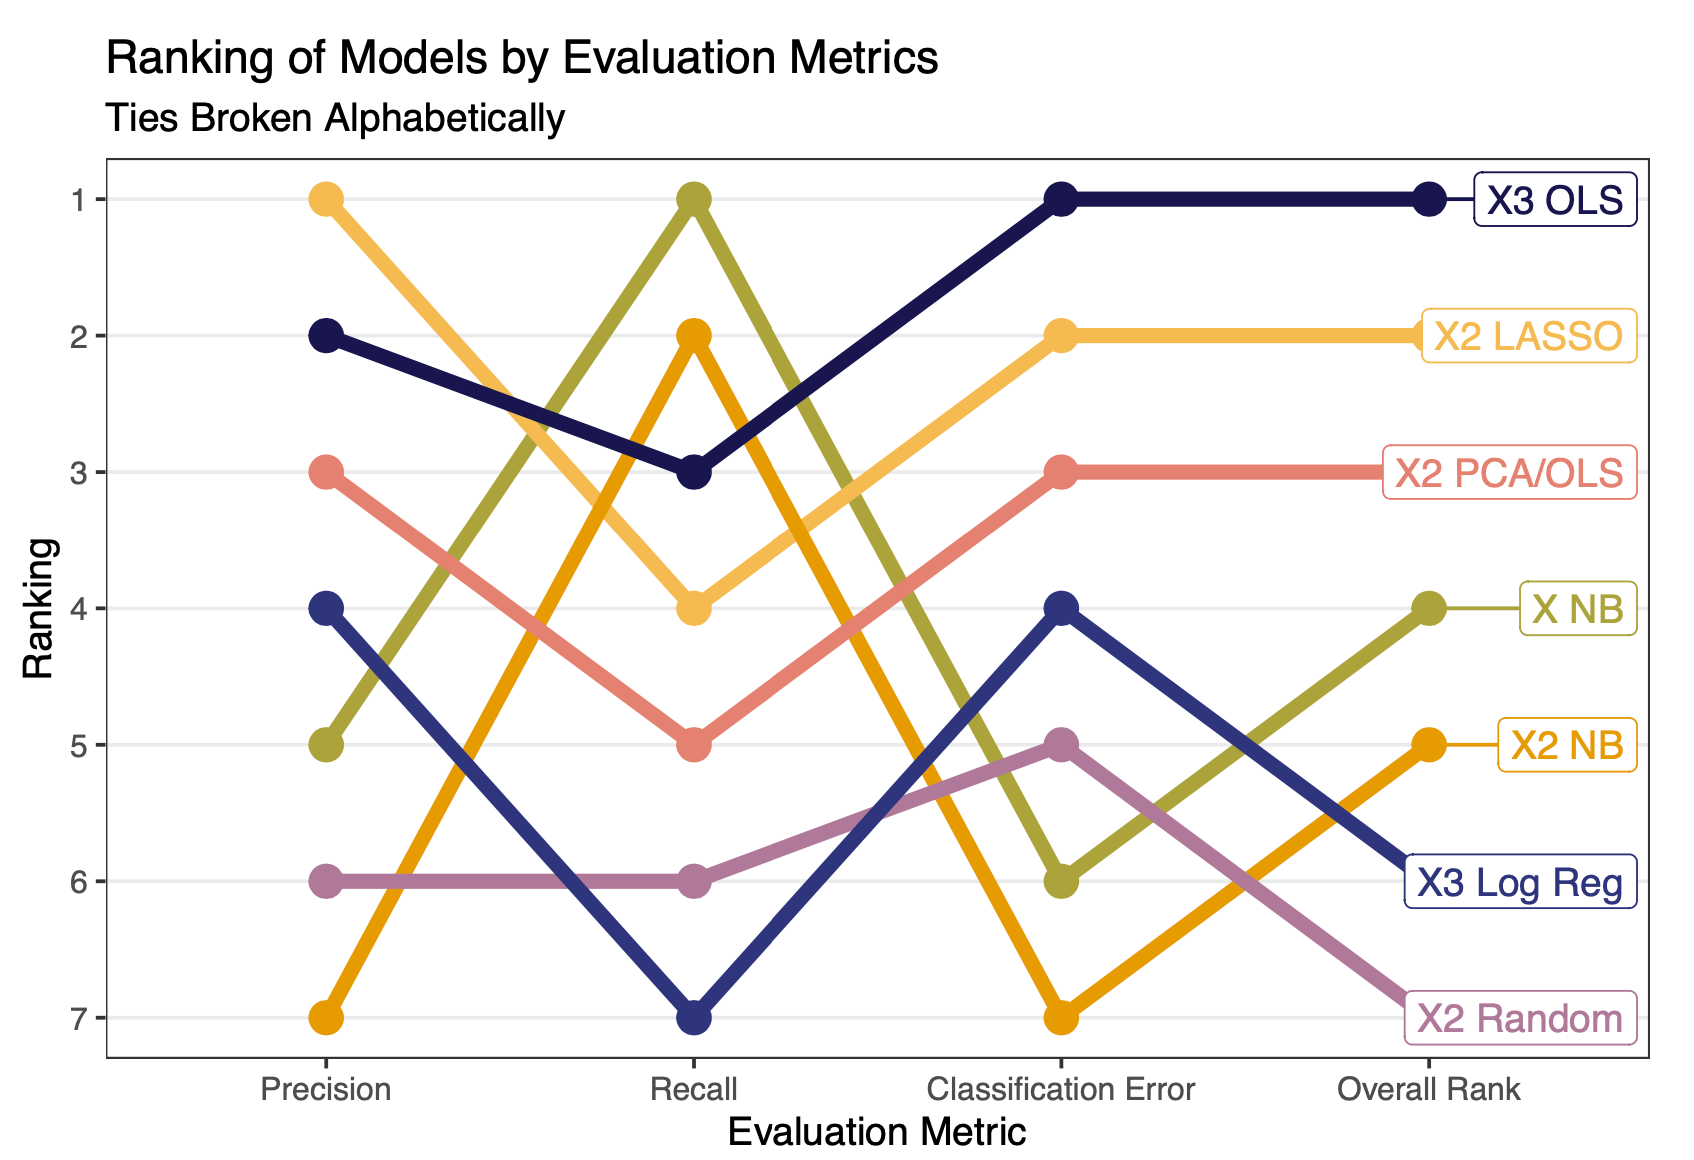
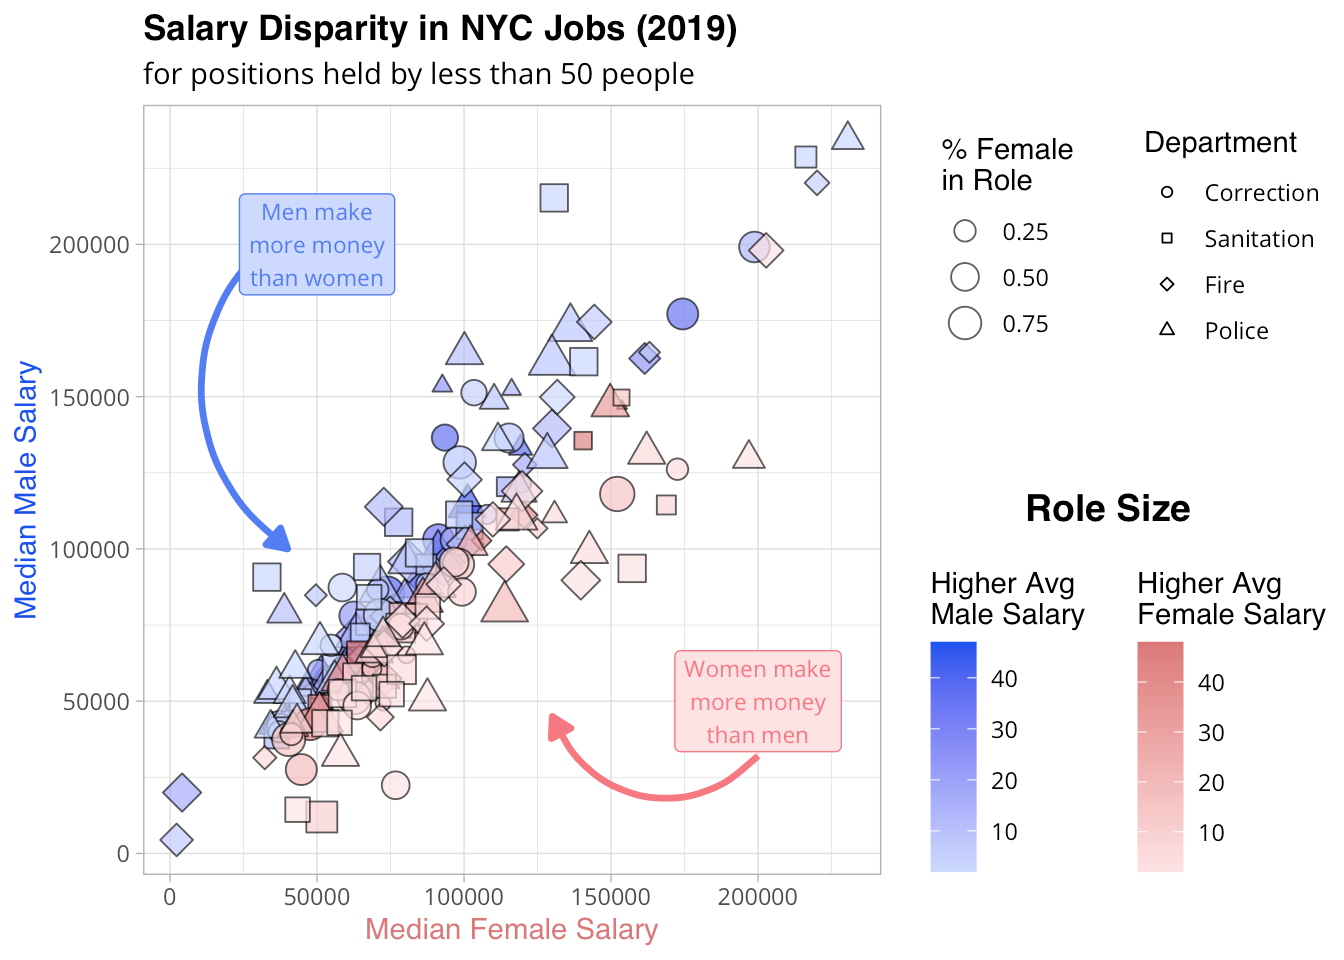
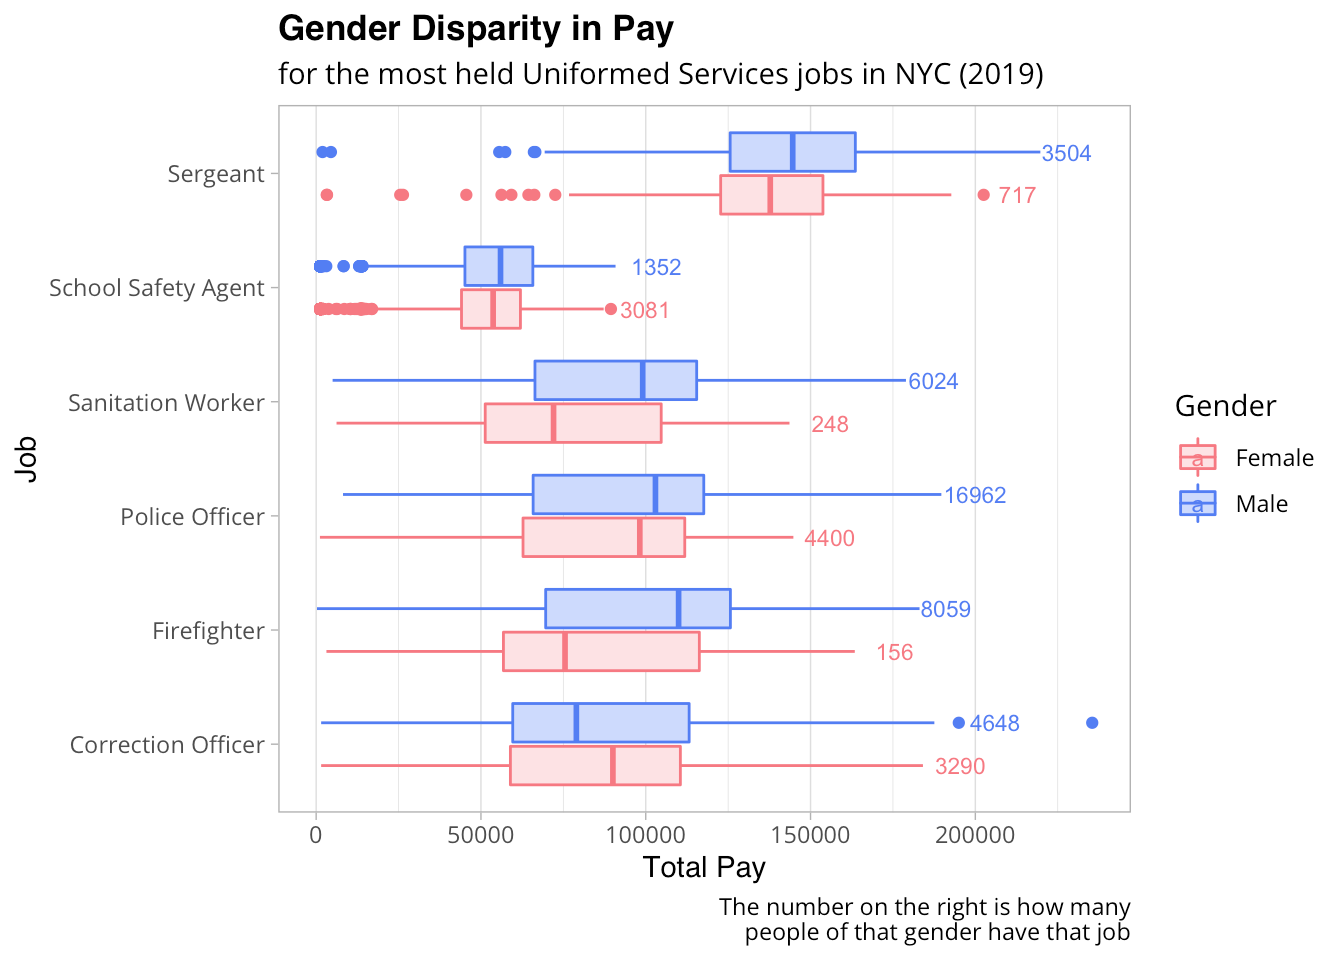
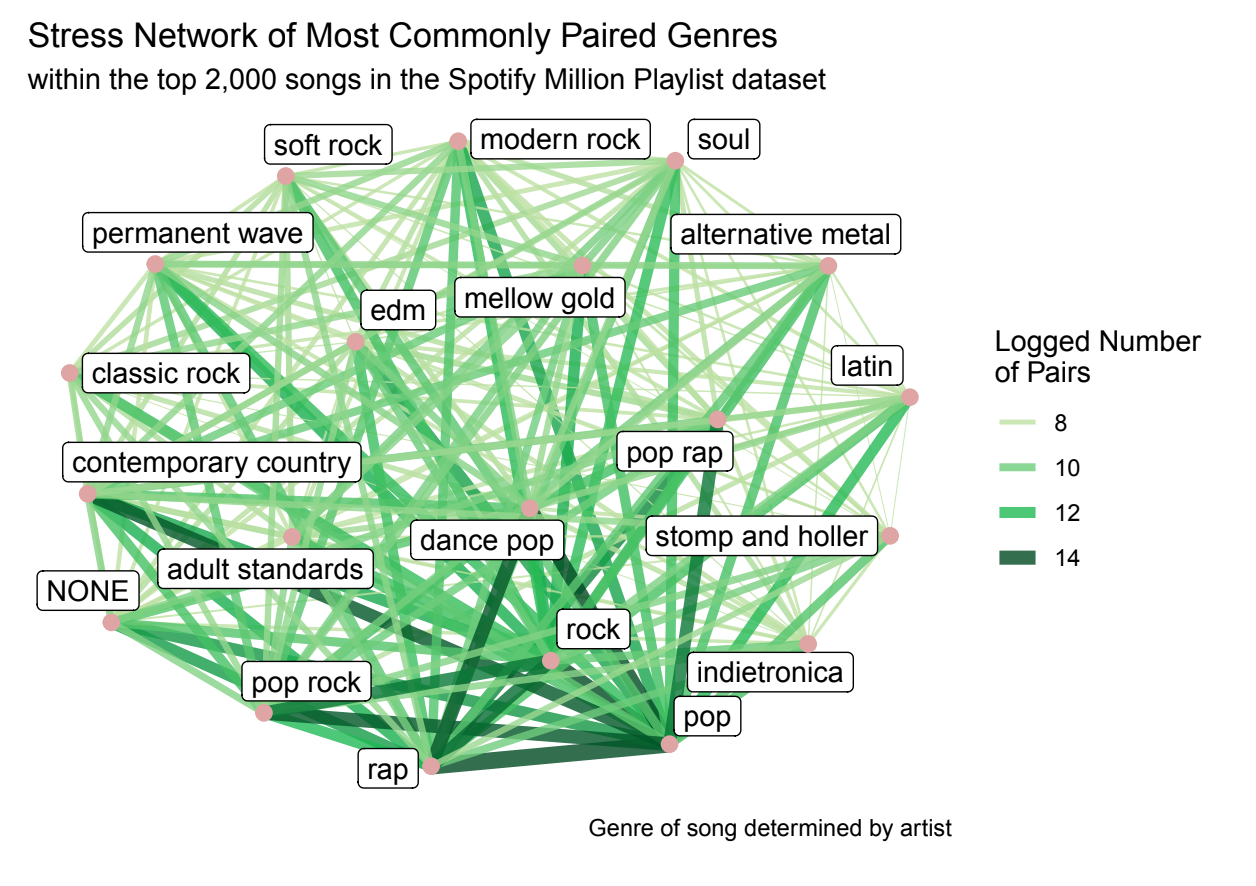
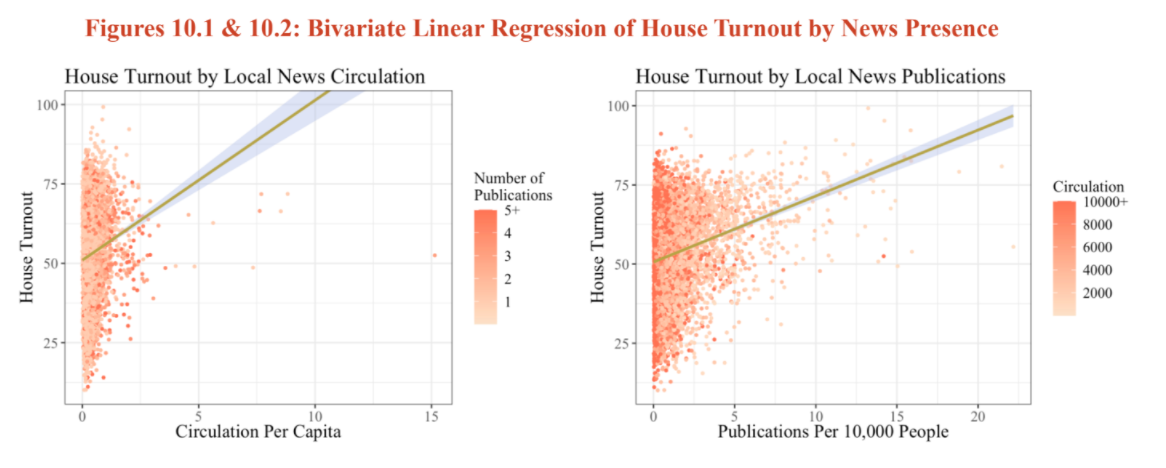
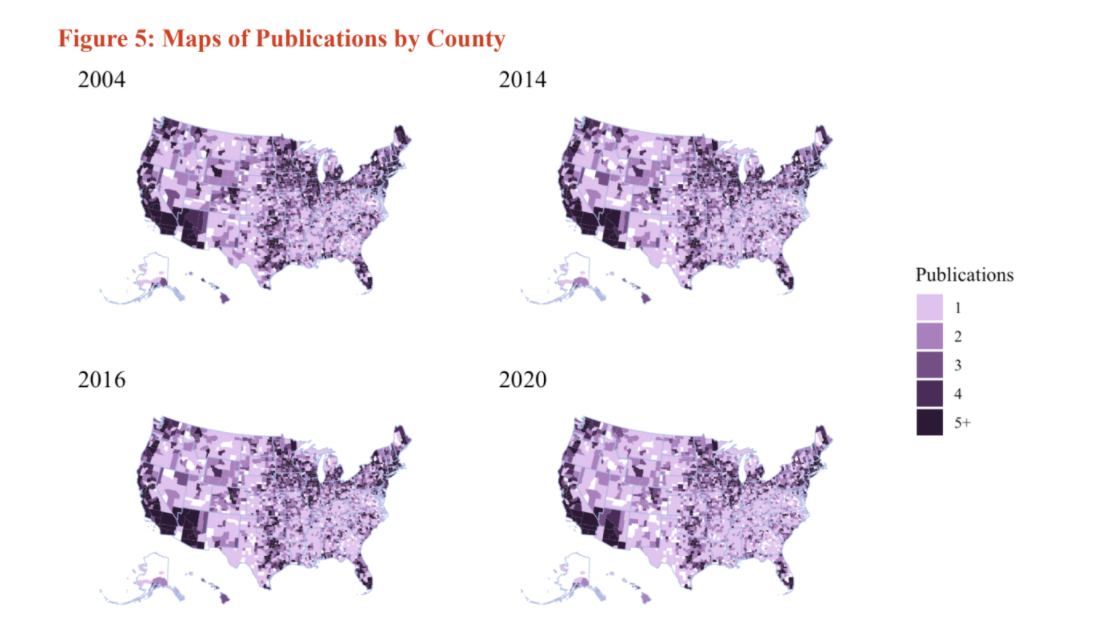
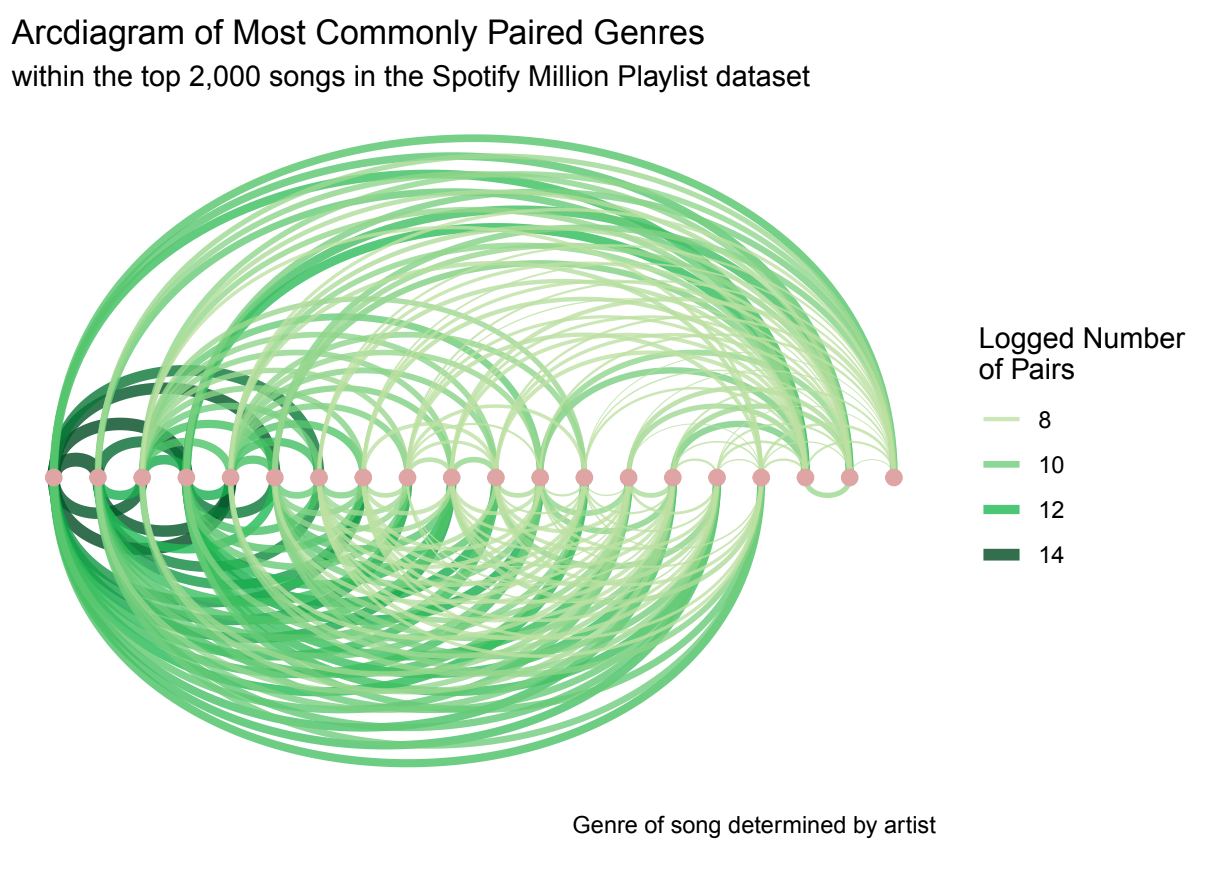
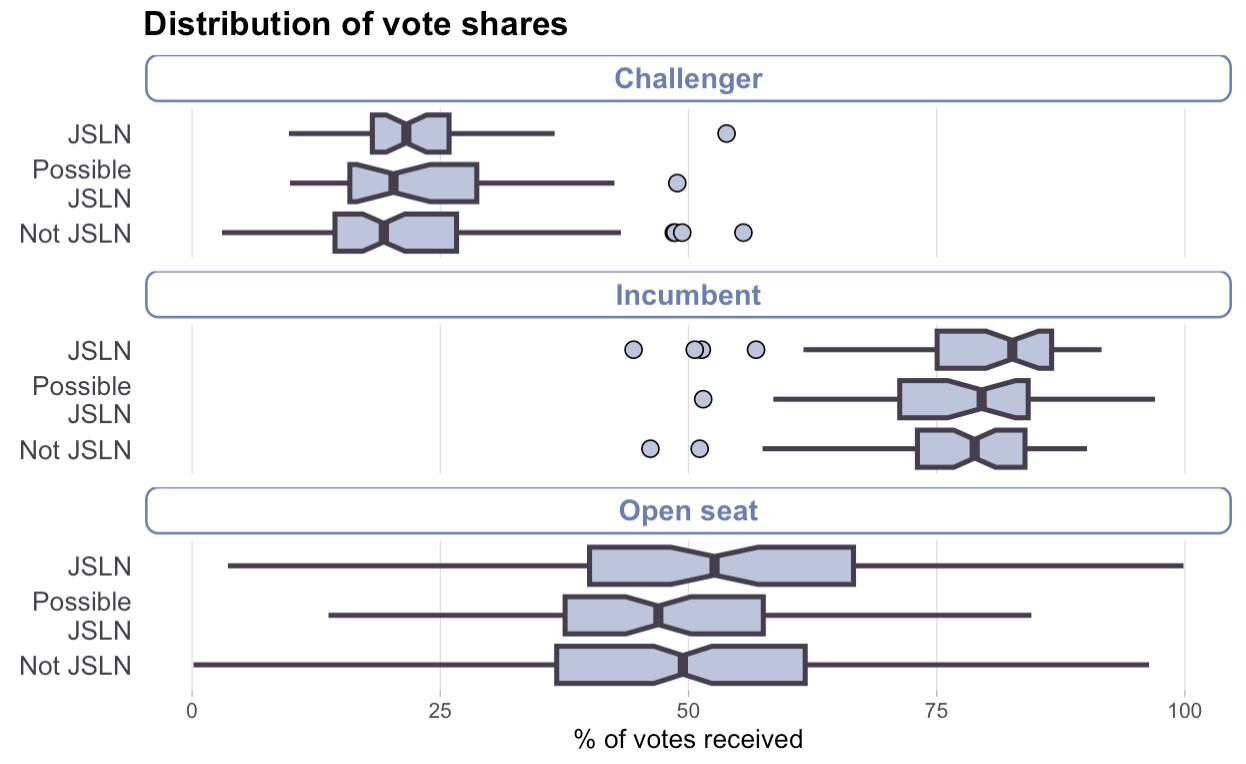
Here are some select charts I made for college assignments — all of these are done purely in R, I really enjoy pushing the boundaries of ggplot and exploring other R packages!